

The whole market is moving in one direction at the same time. From indices to commodities, everything is moving together toward one target. Let’s take a look.
The leaders
We’ll start with the biggest picture and work our way down. First, the leaders of the world’s stock markets, the S&P 500 and the Nasdaq 100.
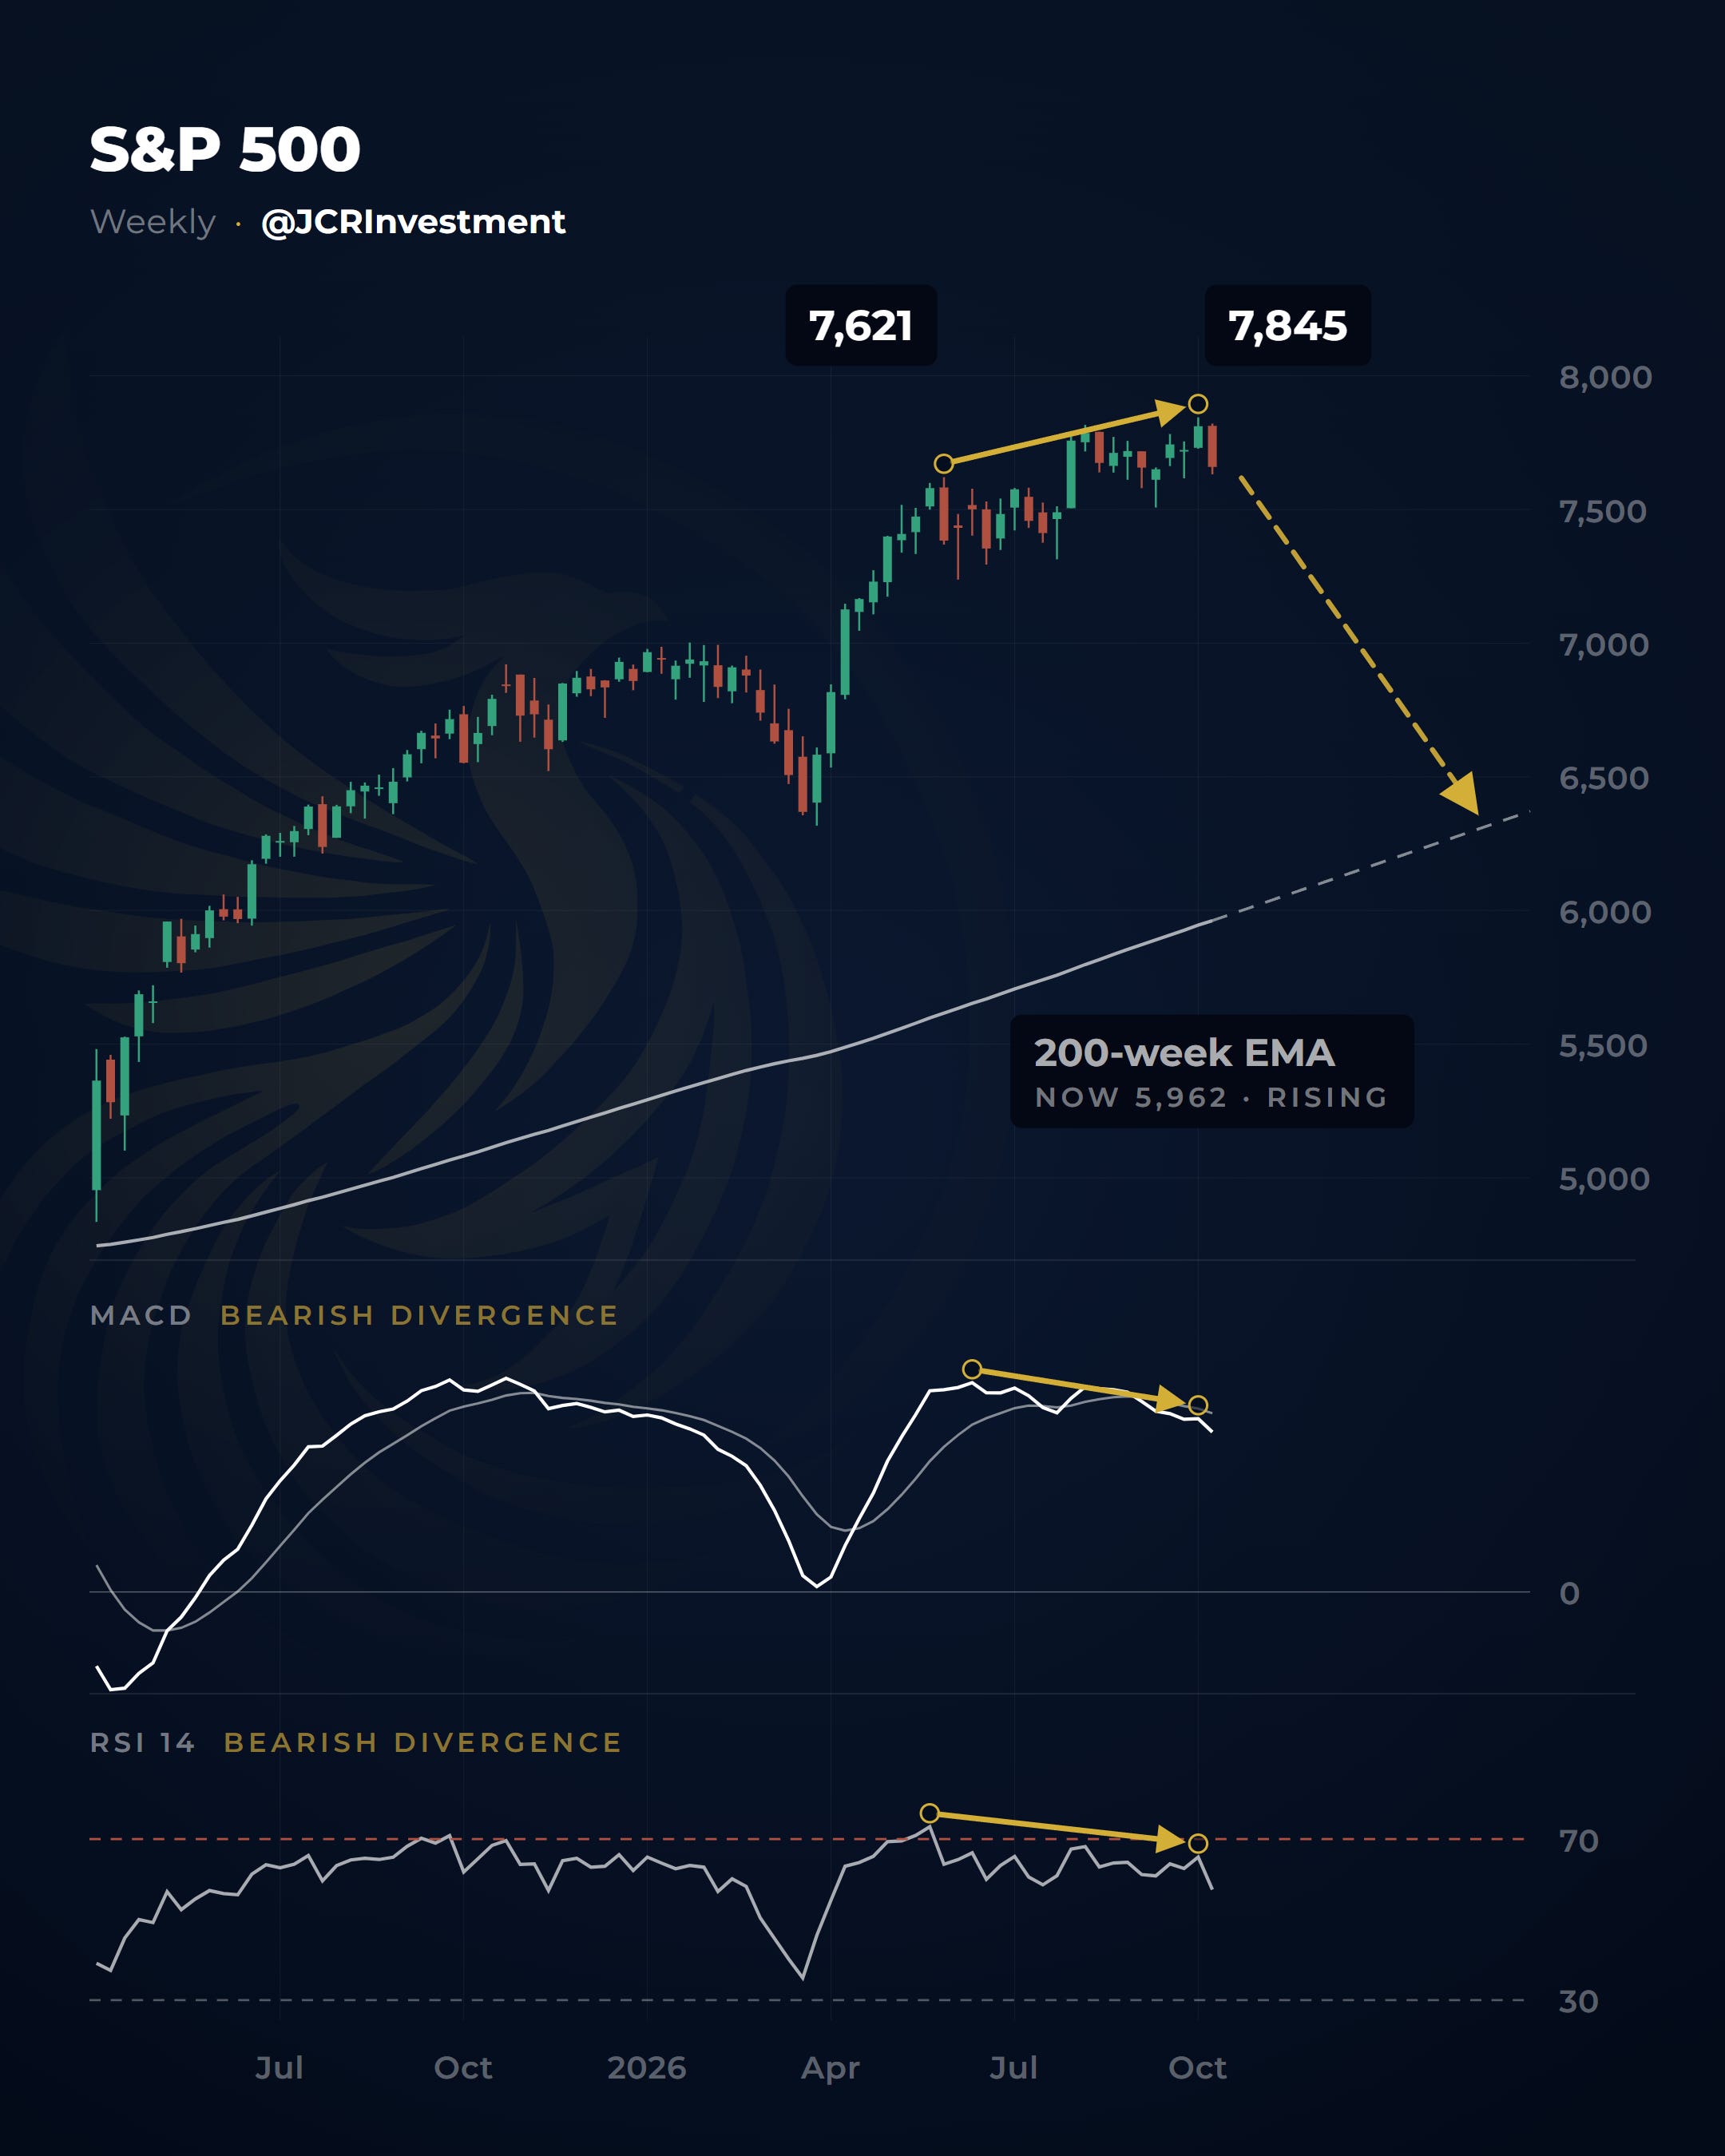
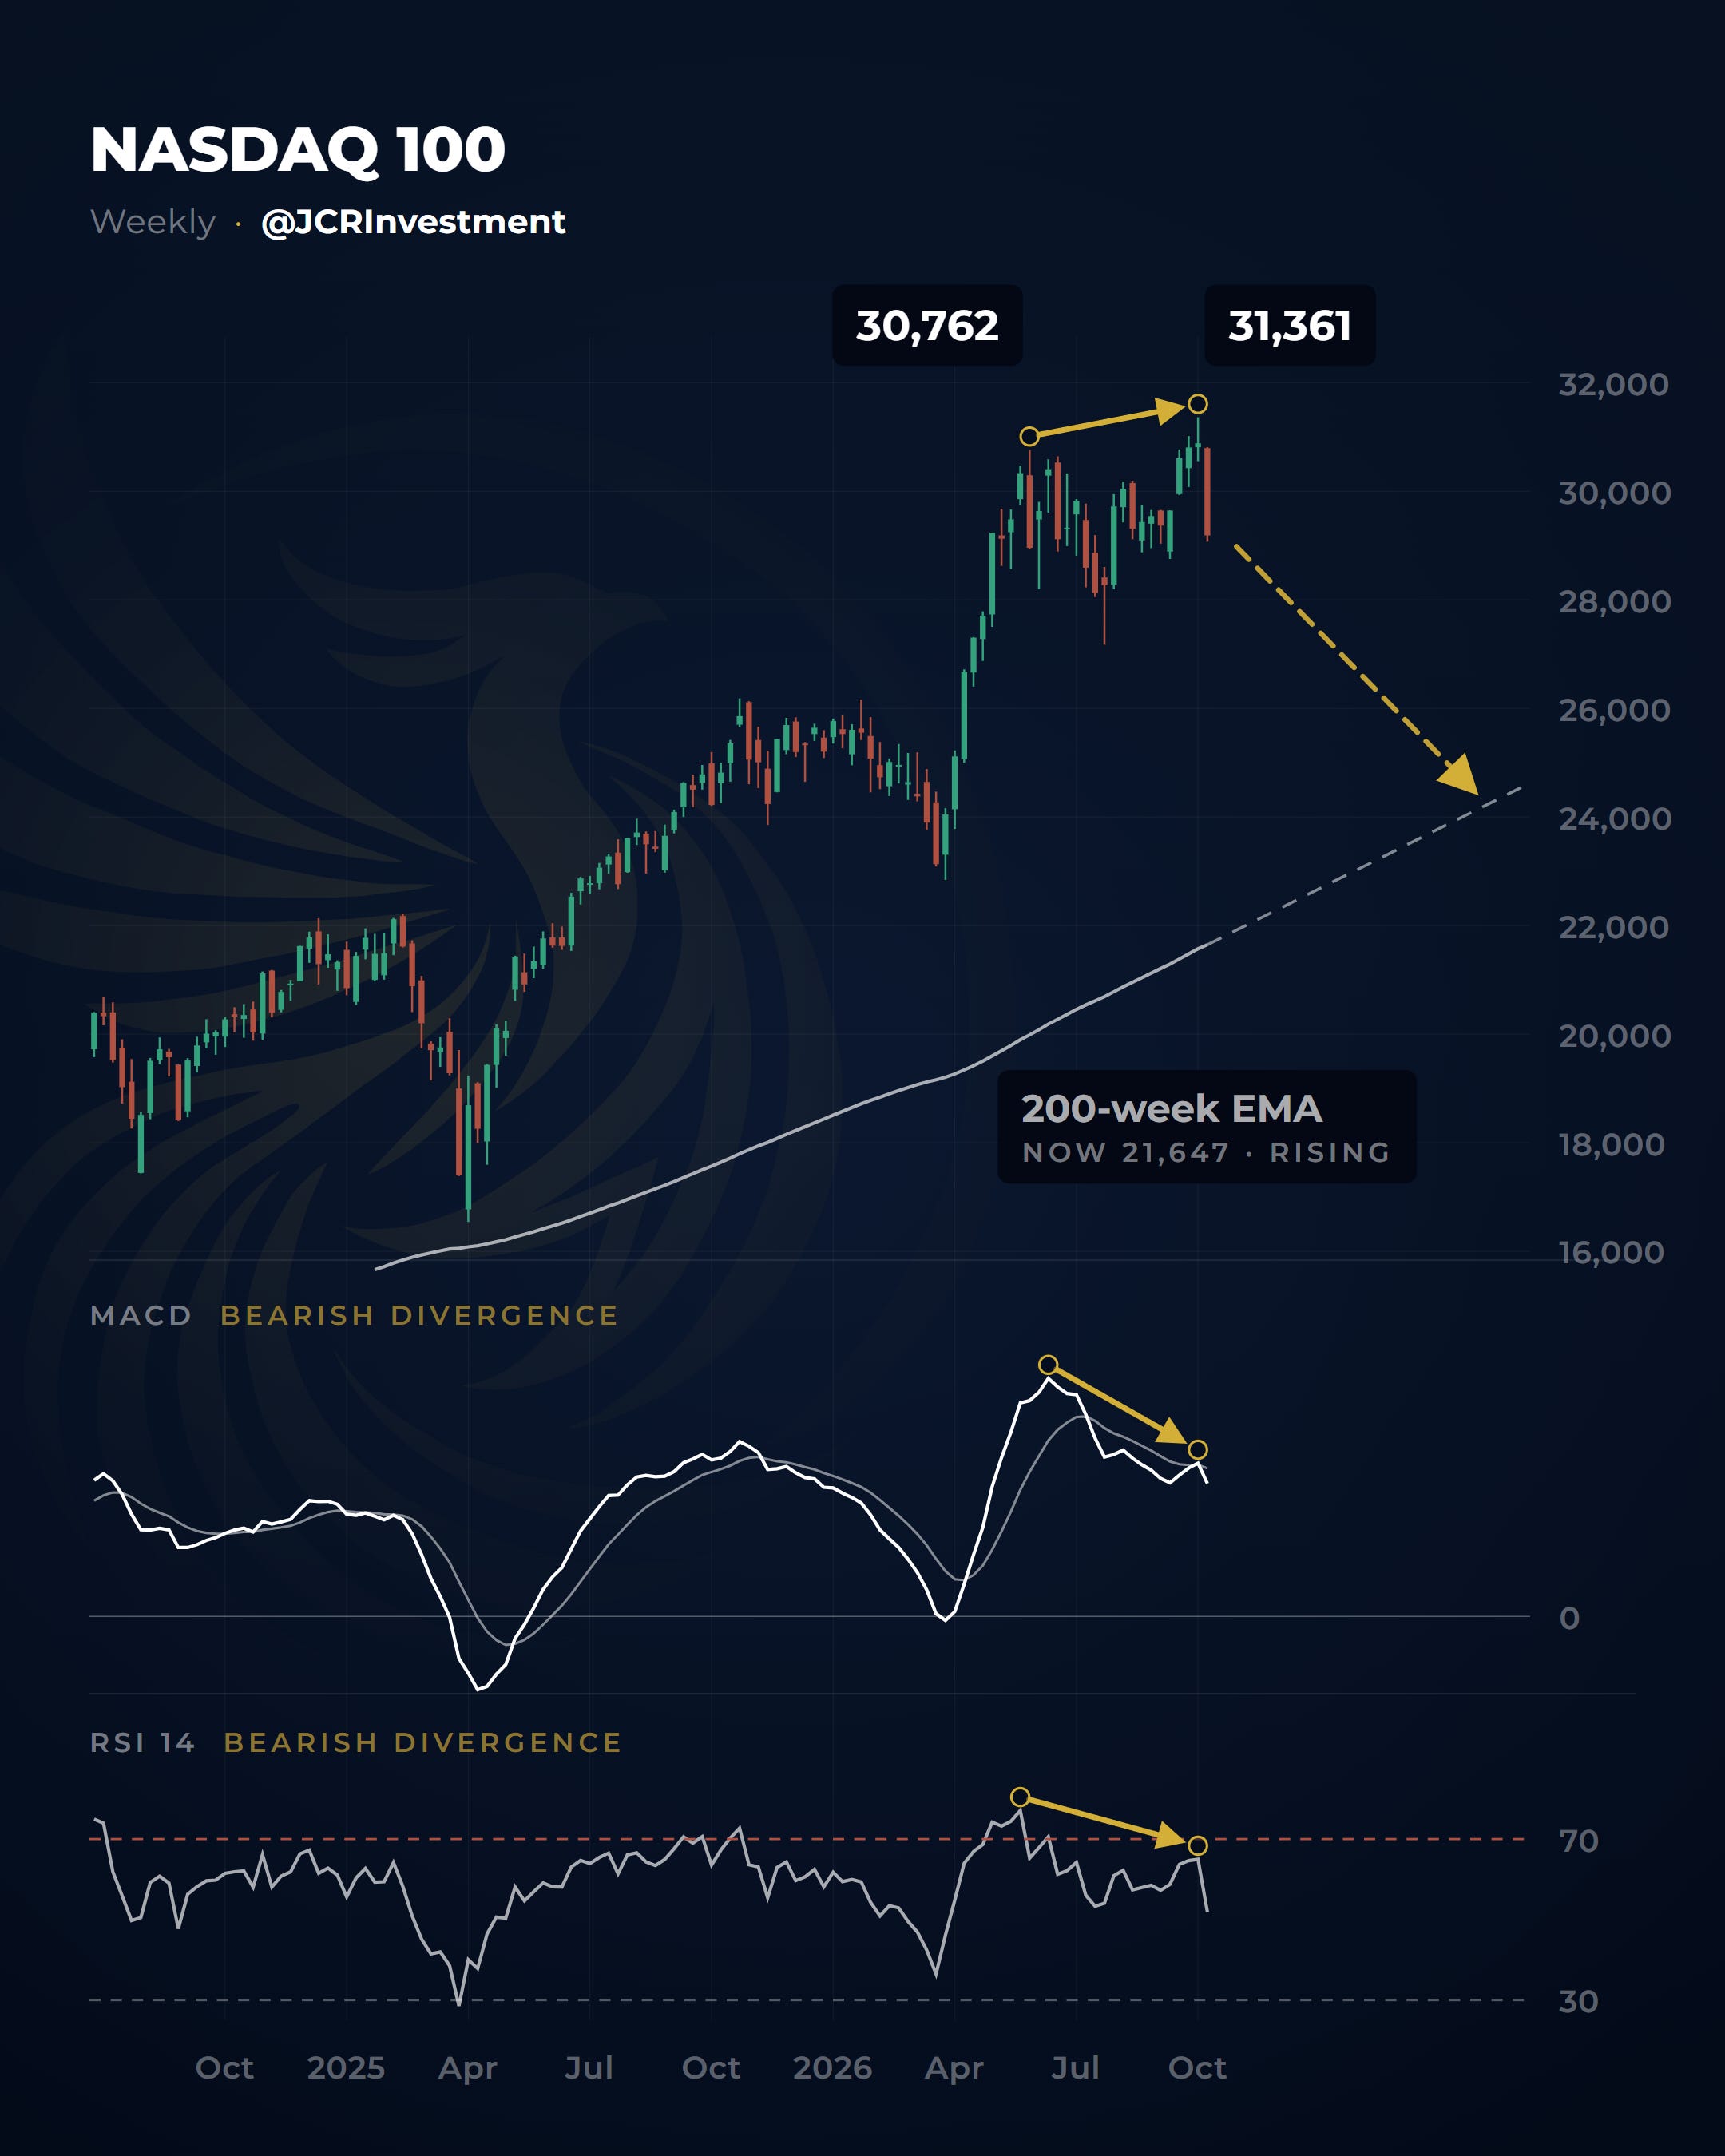
As you can see, both have flashed bearish signals at the same time, pointing to a possible correction down to their weekly moving averages. That would mean a 30% drop for the Nasdaq 100 and a 22% drop for the S&P 500.
On their own, these are two very important signals, but they’re isolated. So let’s see what the rest of the market is saying.
Small and mid caps are a huge part of the market. They’re the first to turn when something is wrong. And as we’ll see, markets are starting to price in a correction. While the main leaders are only now giving signals, others are already feeling it.
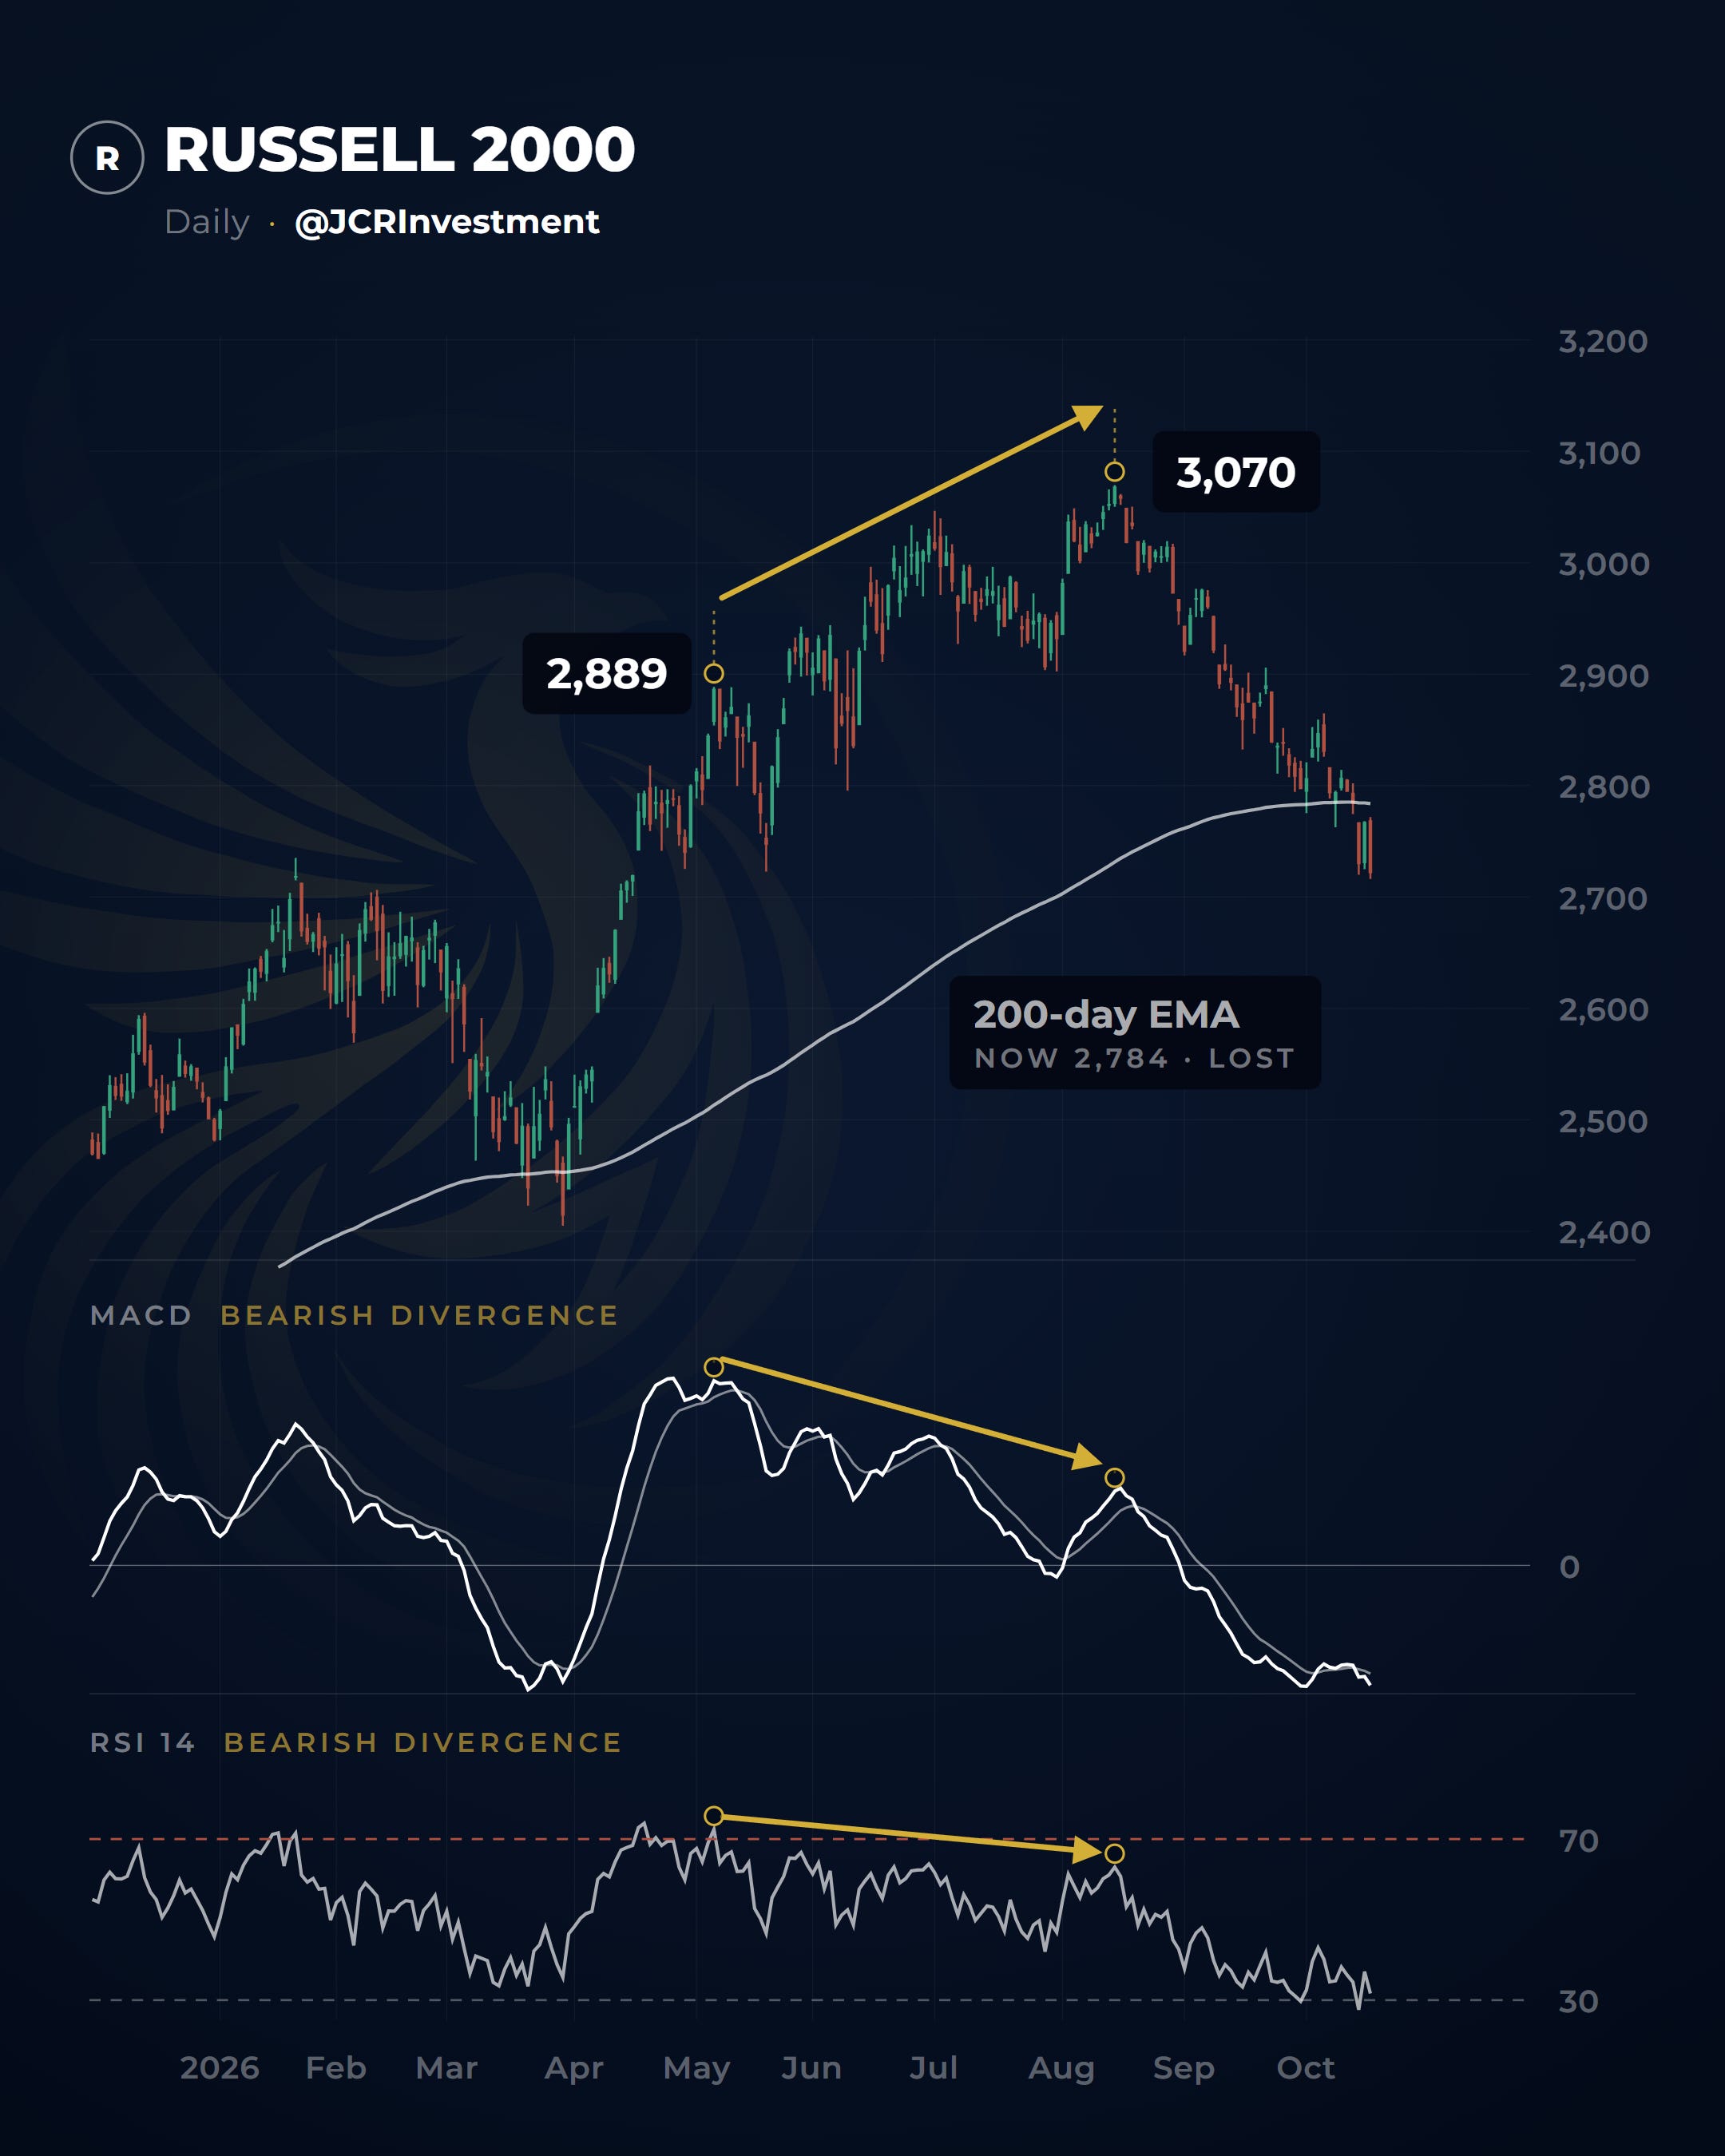
The Russell gave the same bearish signal we just saw on the Nasdaq and the S&P 500, but on its daily chart, and it’s already paying for it. A 10% drop, with a correction to its moving average, which it lost just as I was writing this.
To keep this article from getting too long, I won’t show other indices. But this is starting to show up across the market, in many of the most important global indices, like Europe, Japan and China.
Now let’s look at what the biggest components of these indices are saying. Market breadth is pretty bad right now, so if these leaders fail, the indices have no ground underneath to hold them up. In fact, look at this.
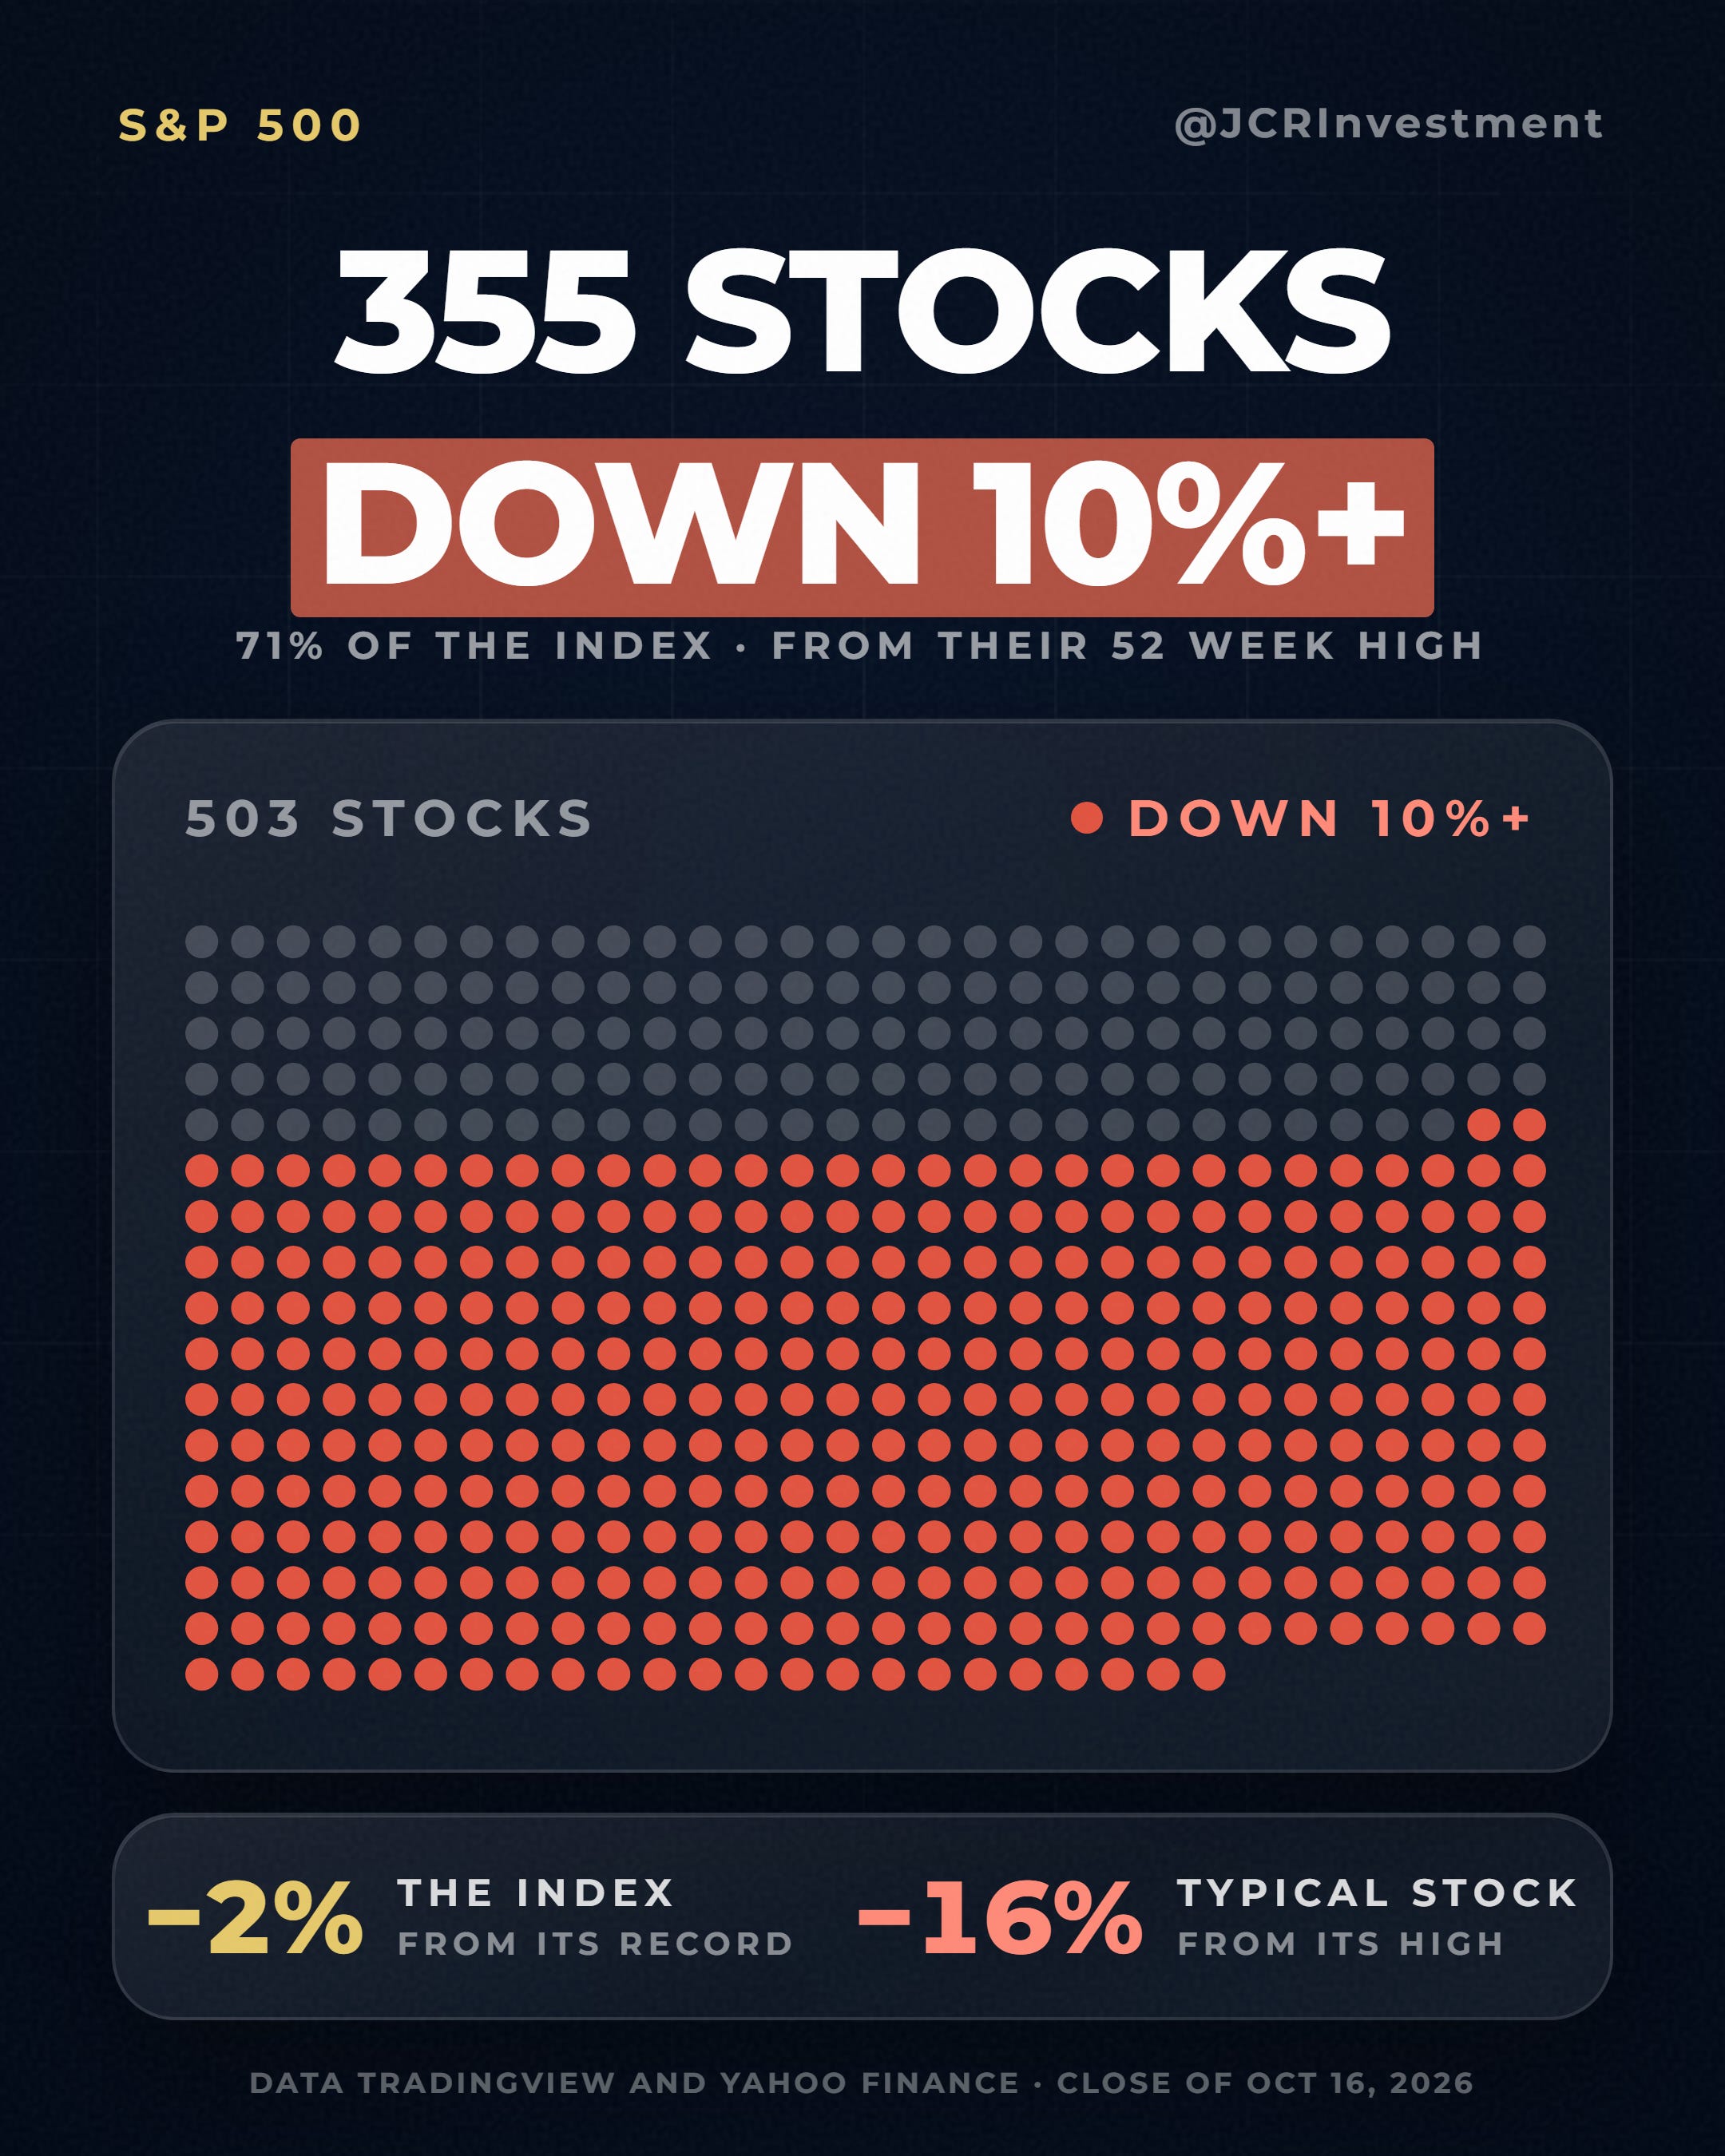
Most stocks in these indices are already in a correction. That’s why, if the leaders fail, the indices will turn lower, and they’re already starting to warn us. Let’s look at them.
Tech
The sector that has driven the stock market since 2022 and the arrival of ChatGPT is, without a doubt, semiconductors and tech. Well, this is what they’re starting to signal.
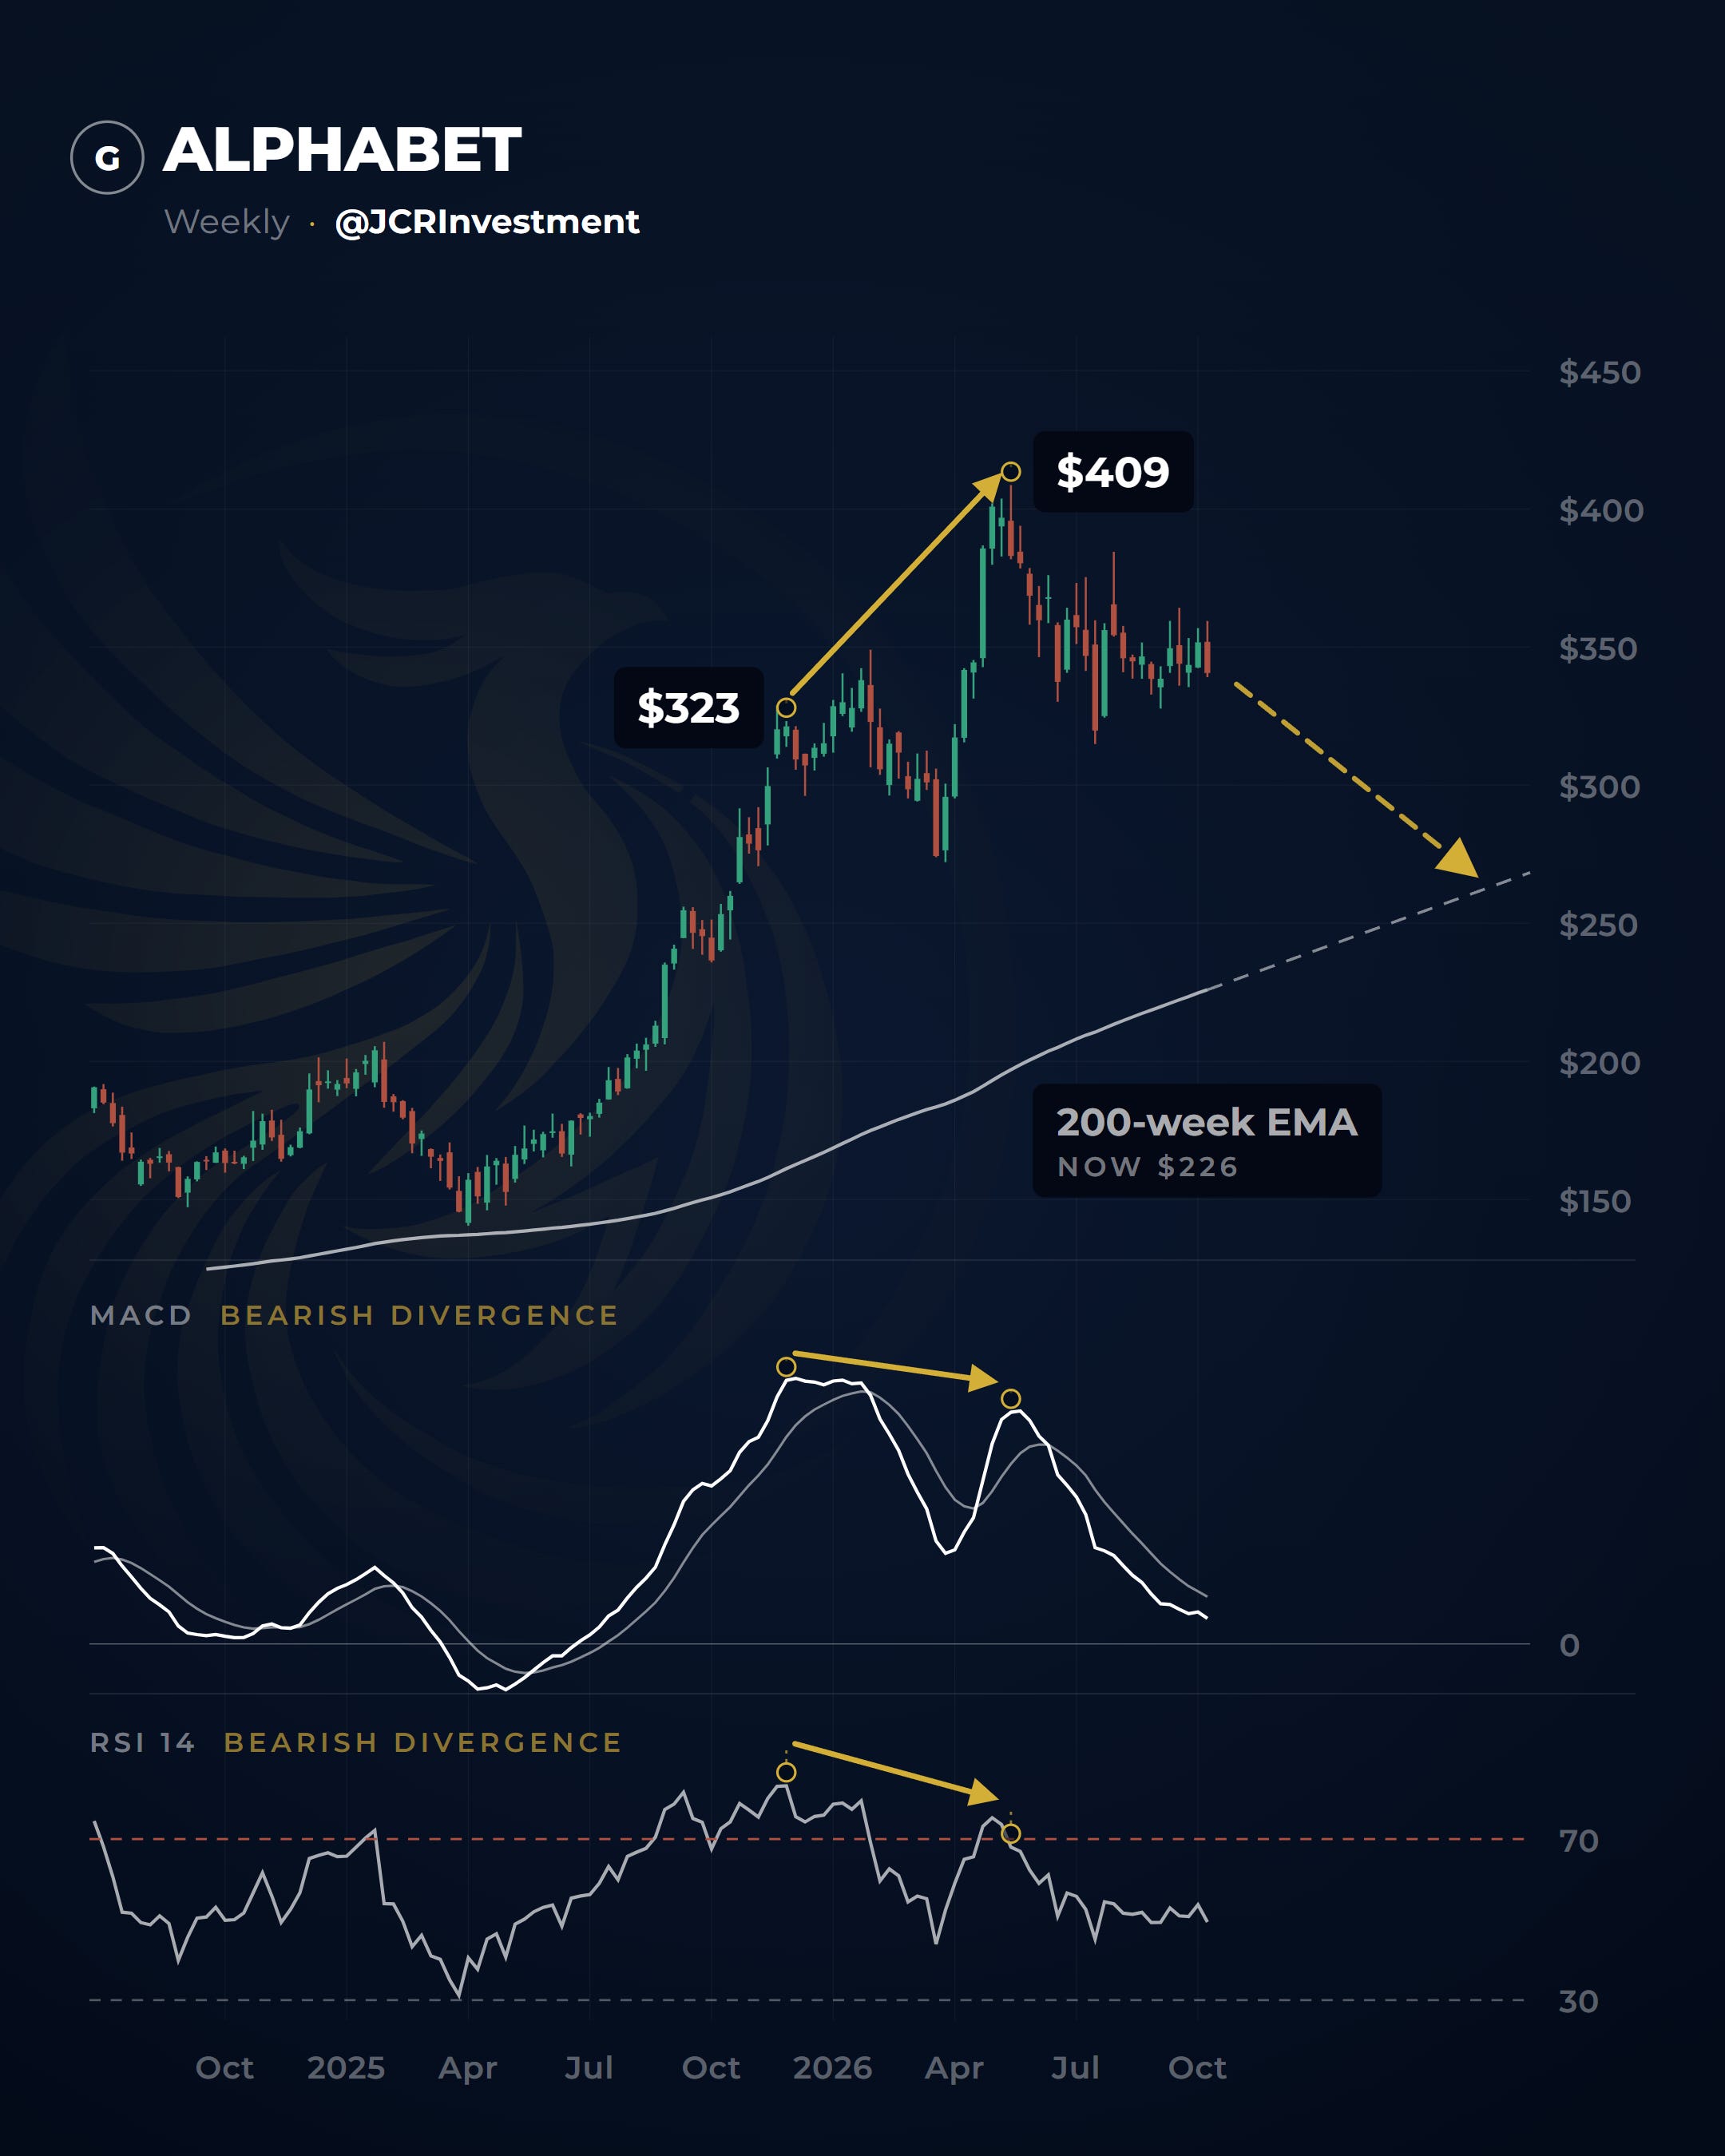
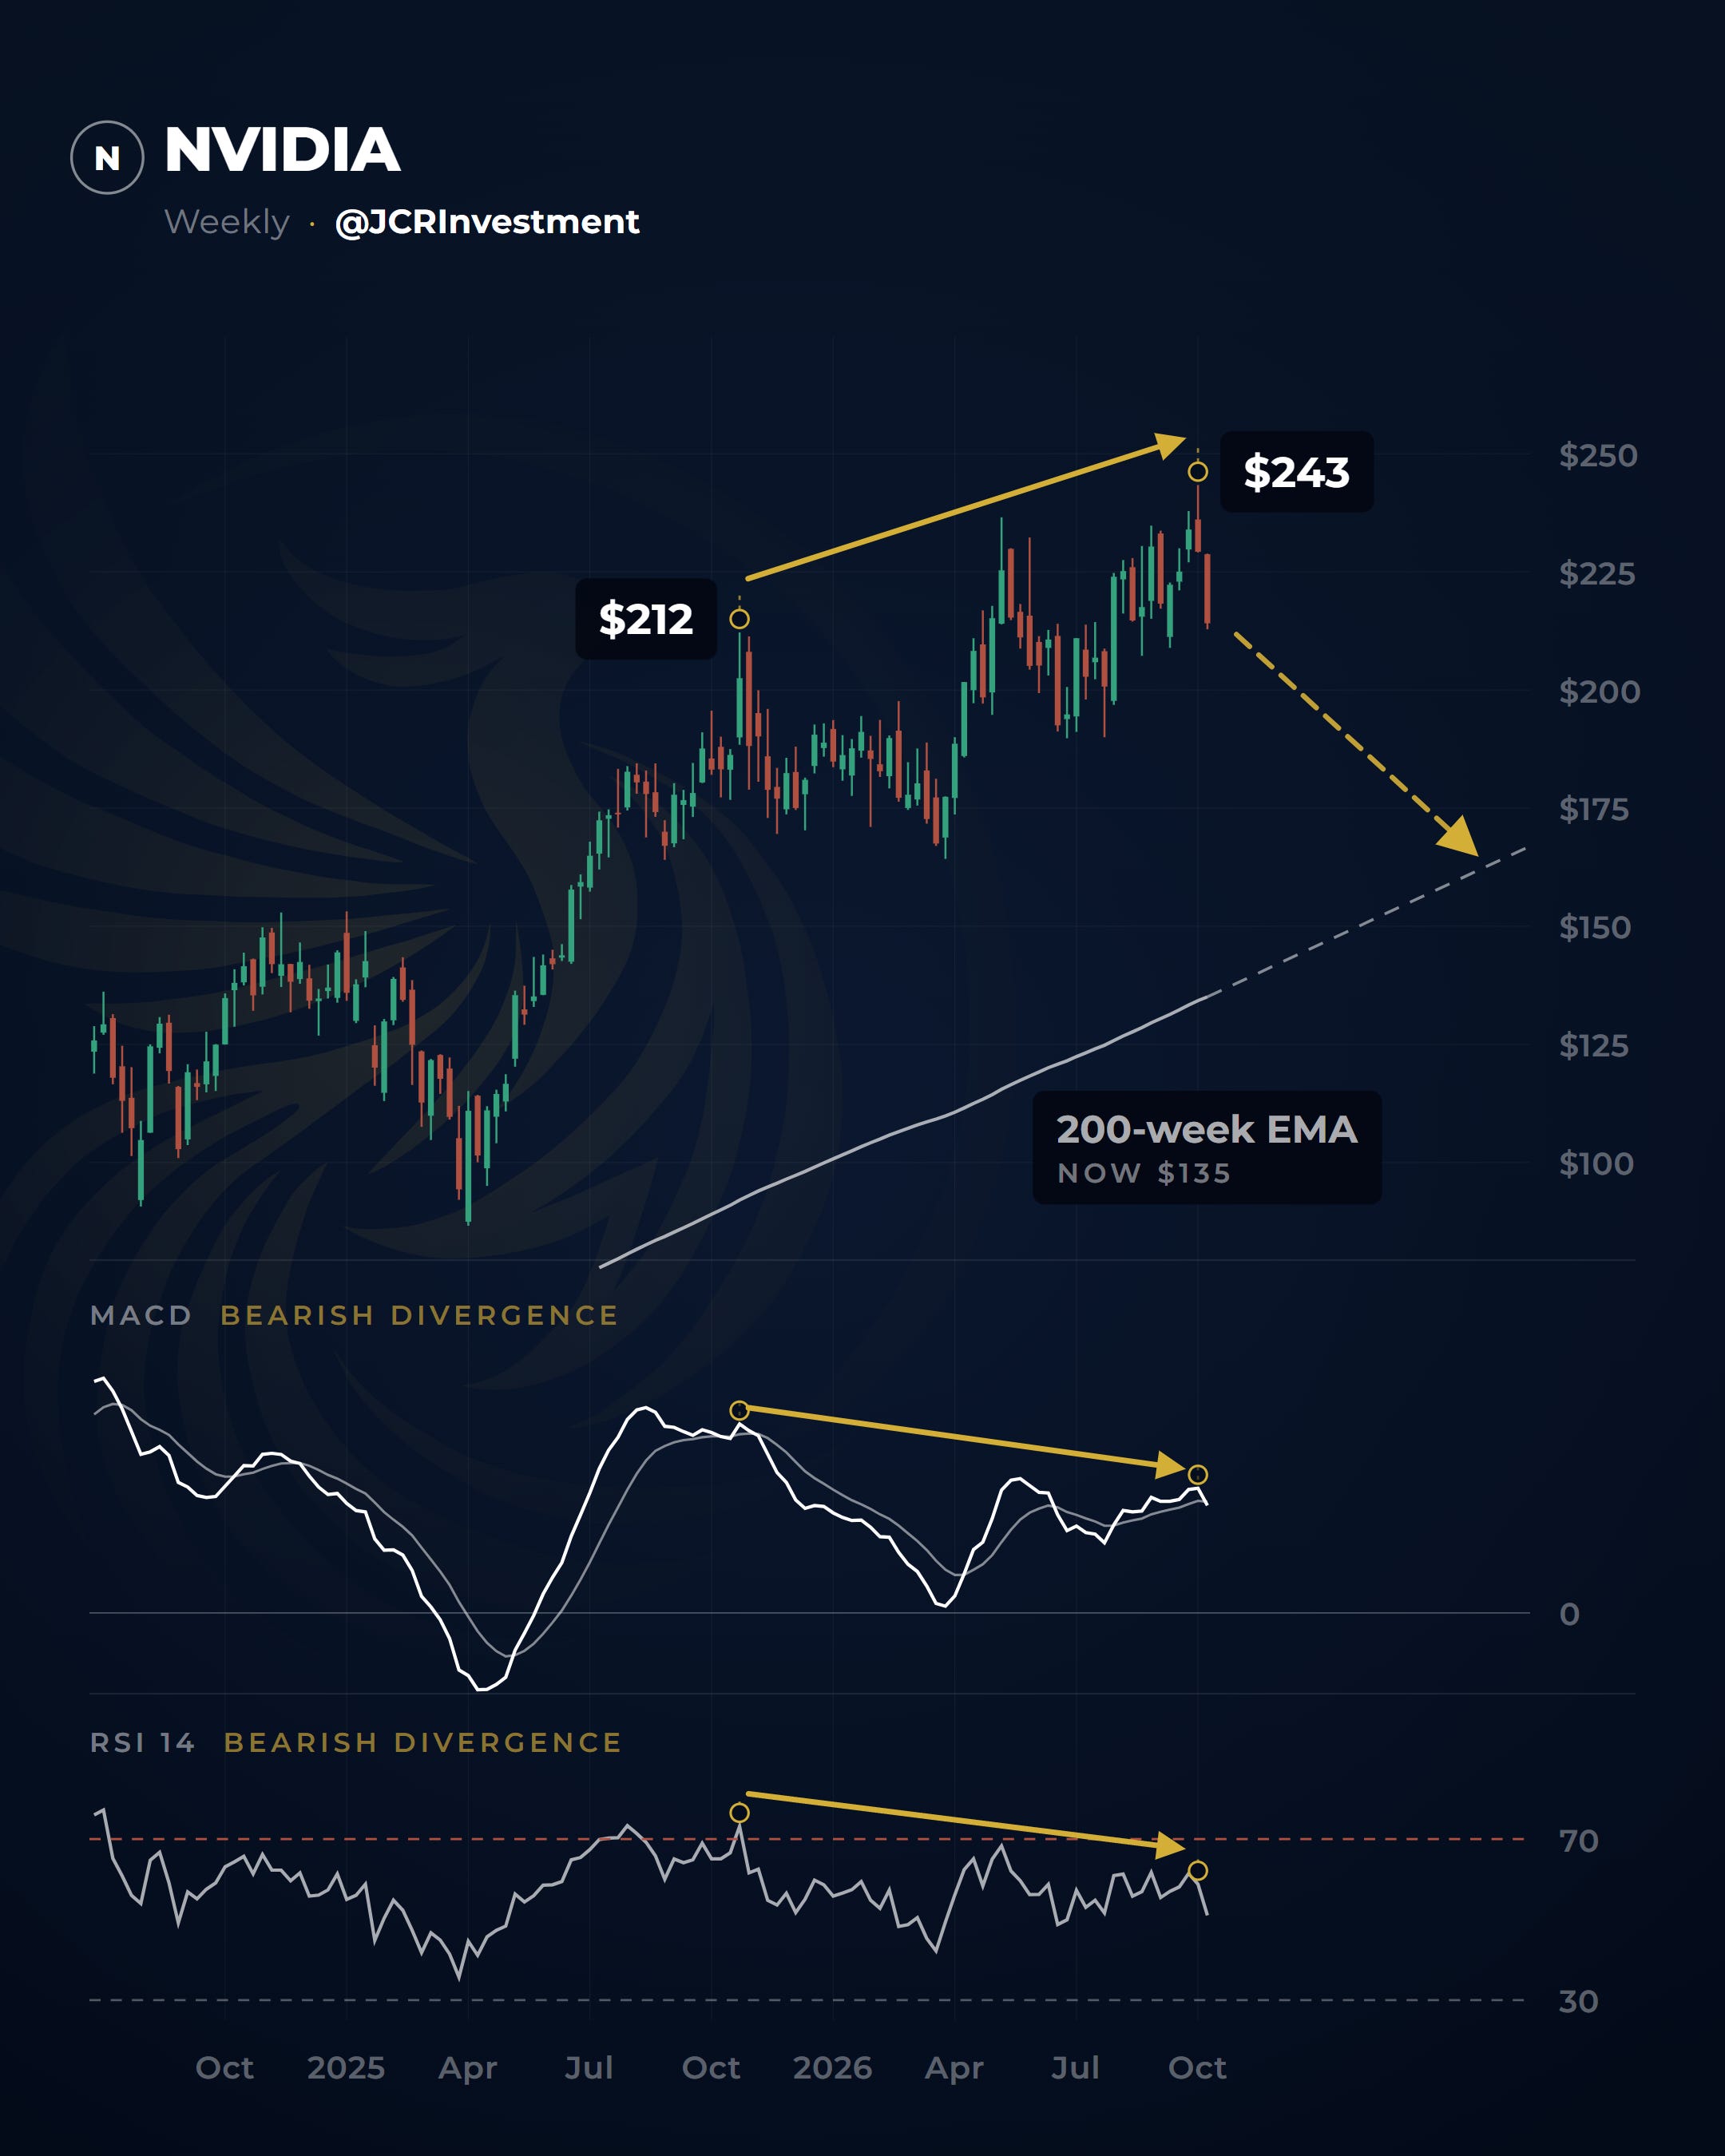
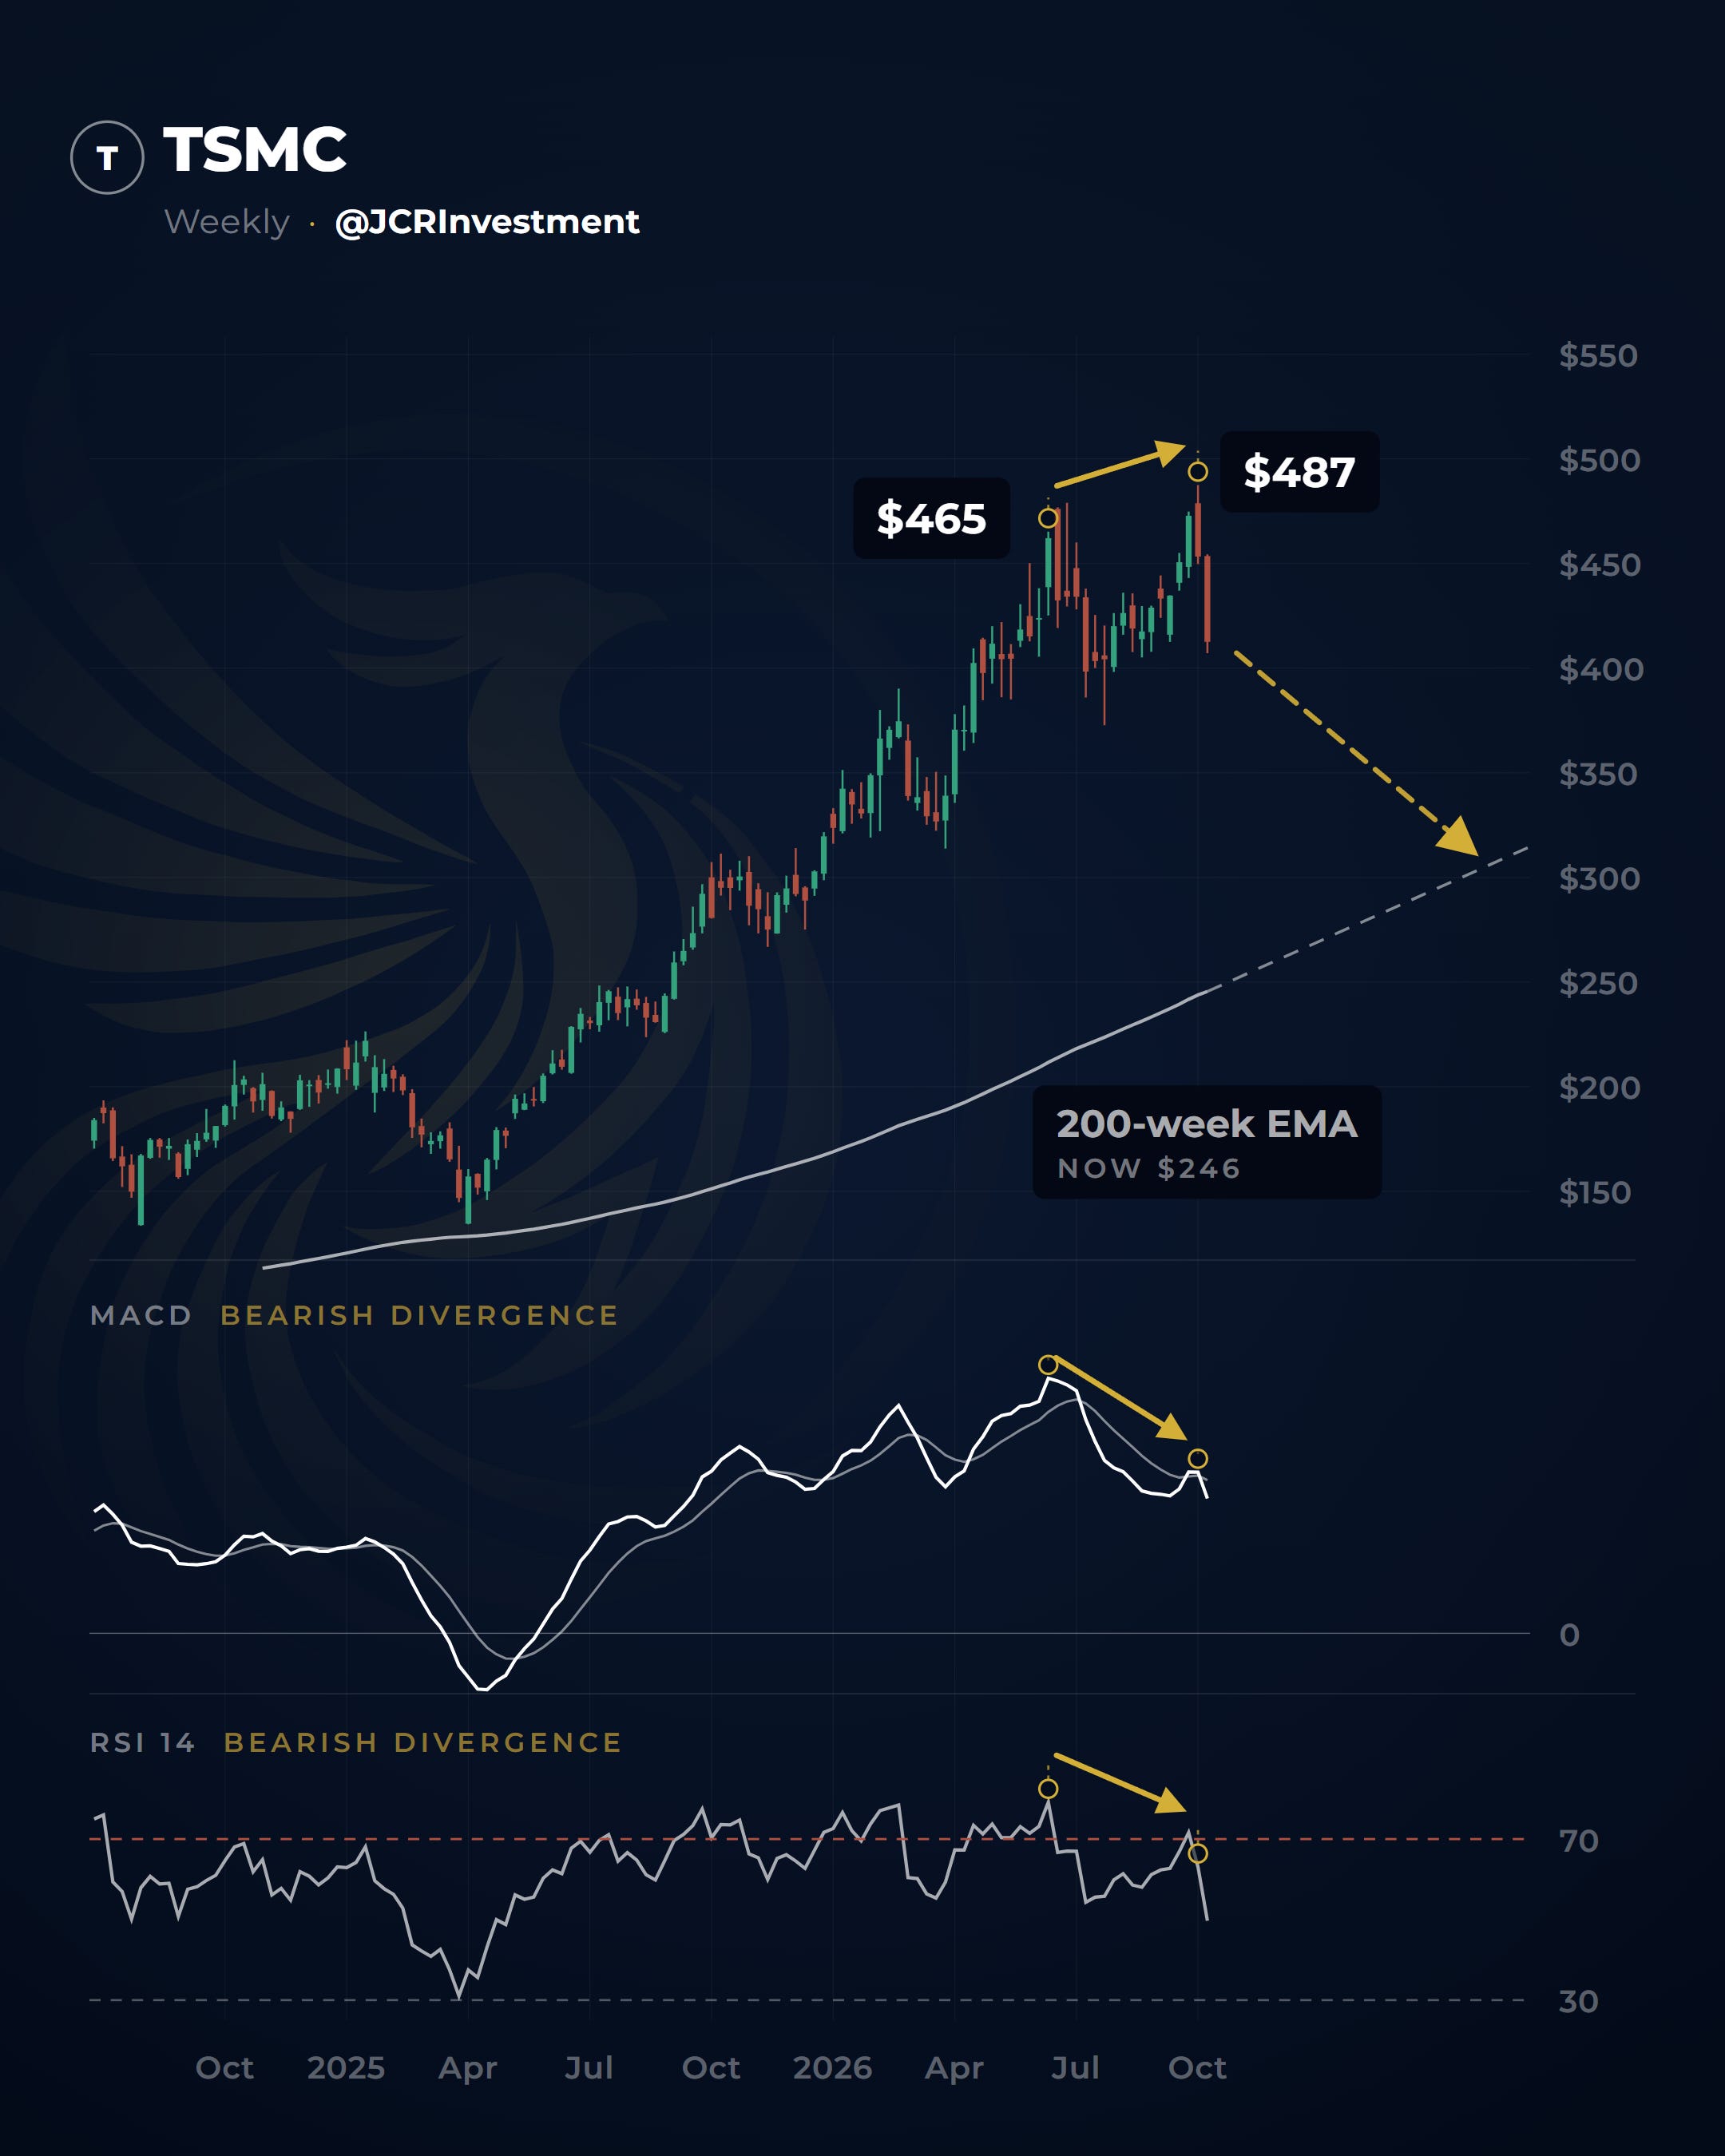
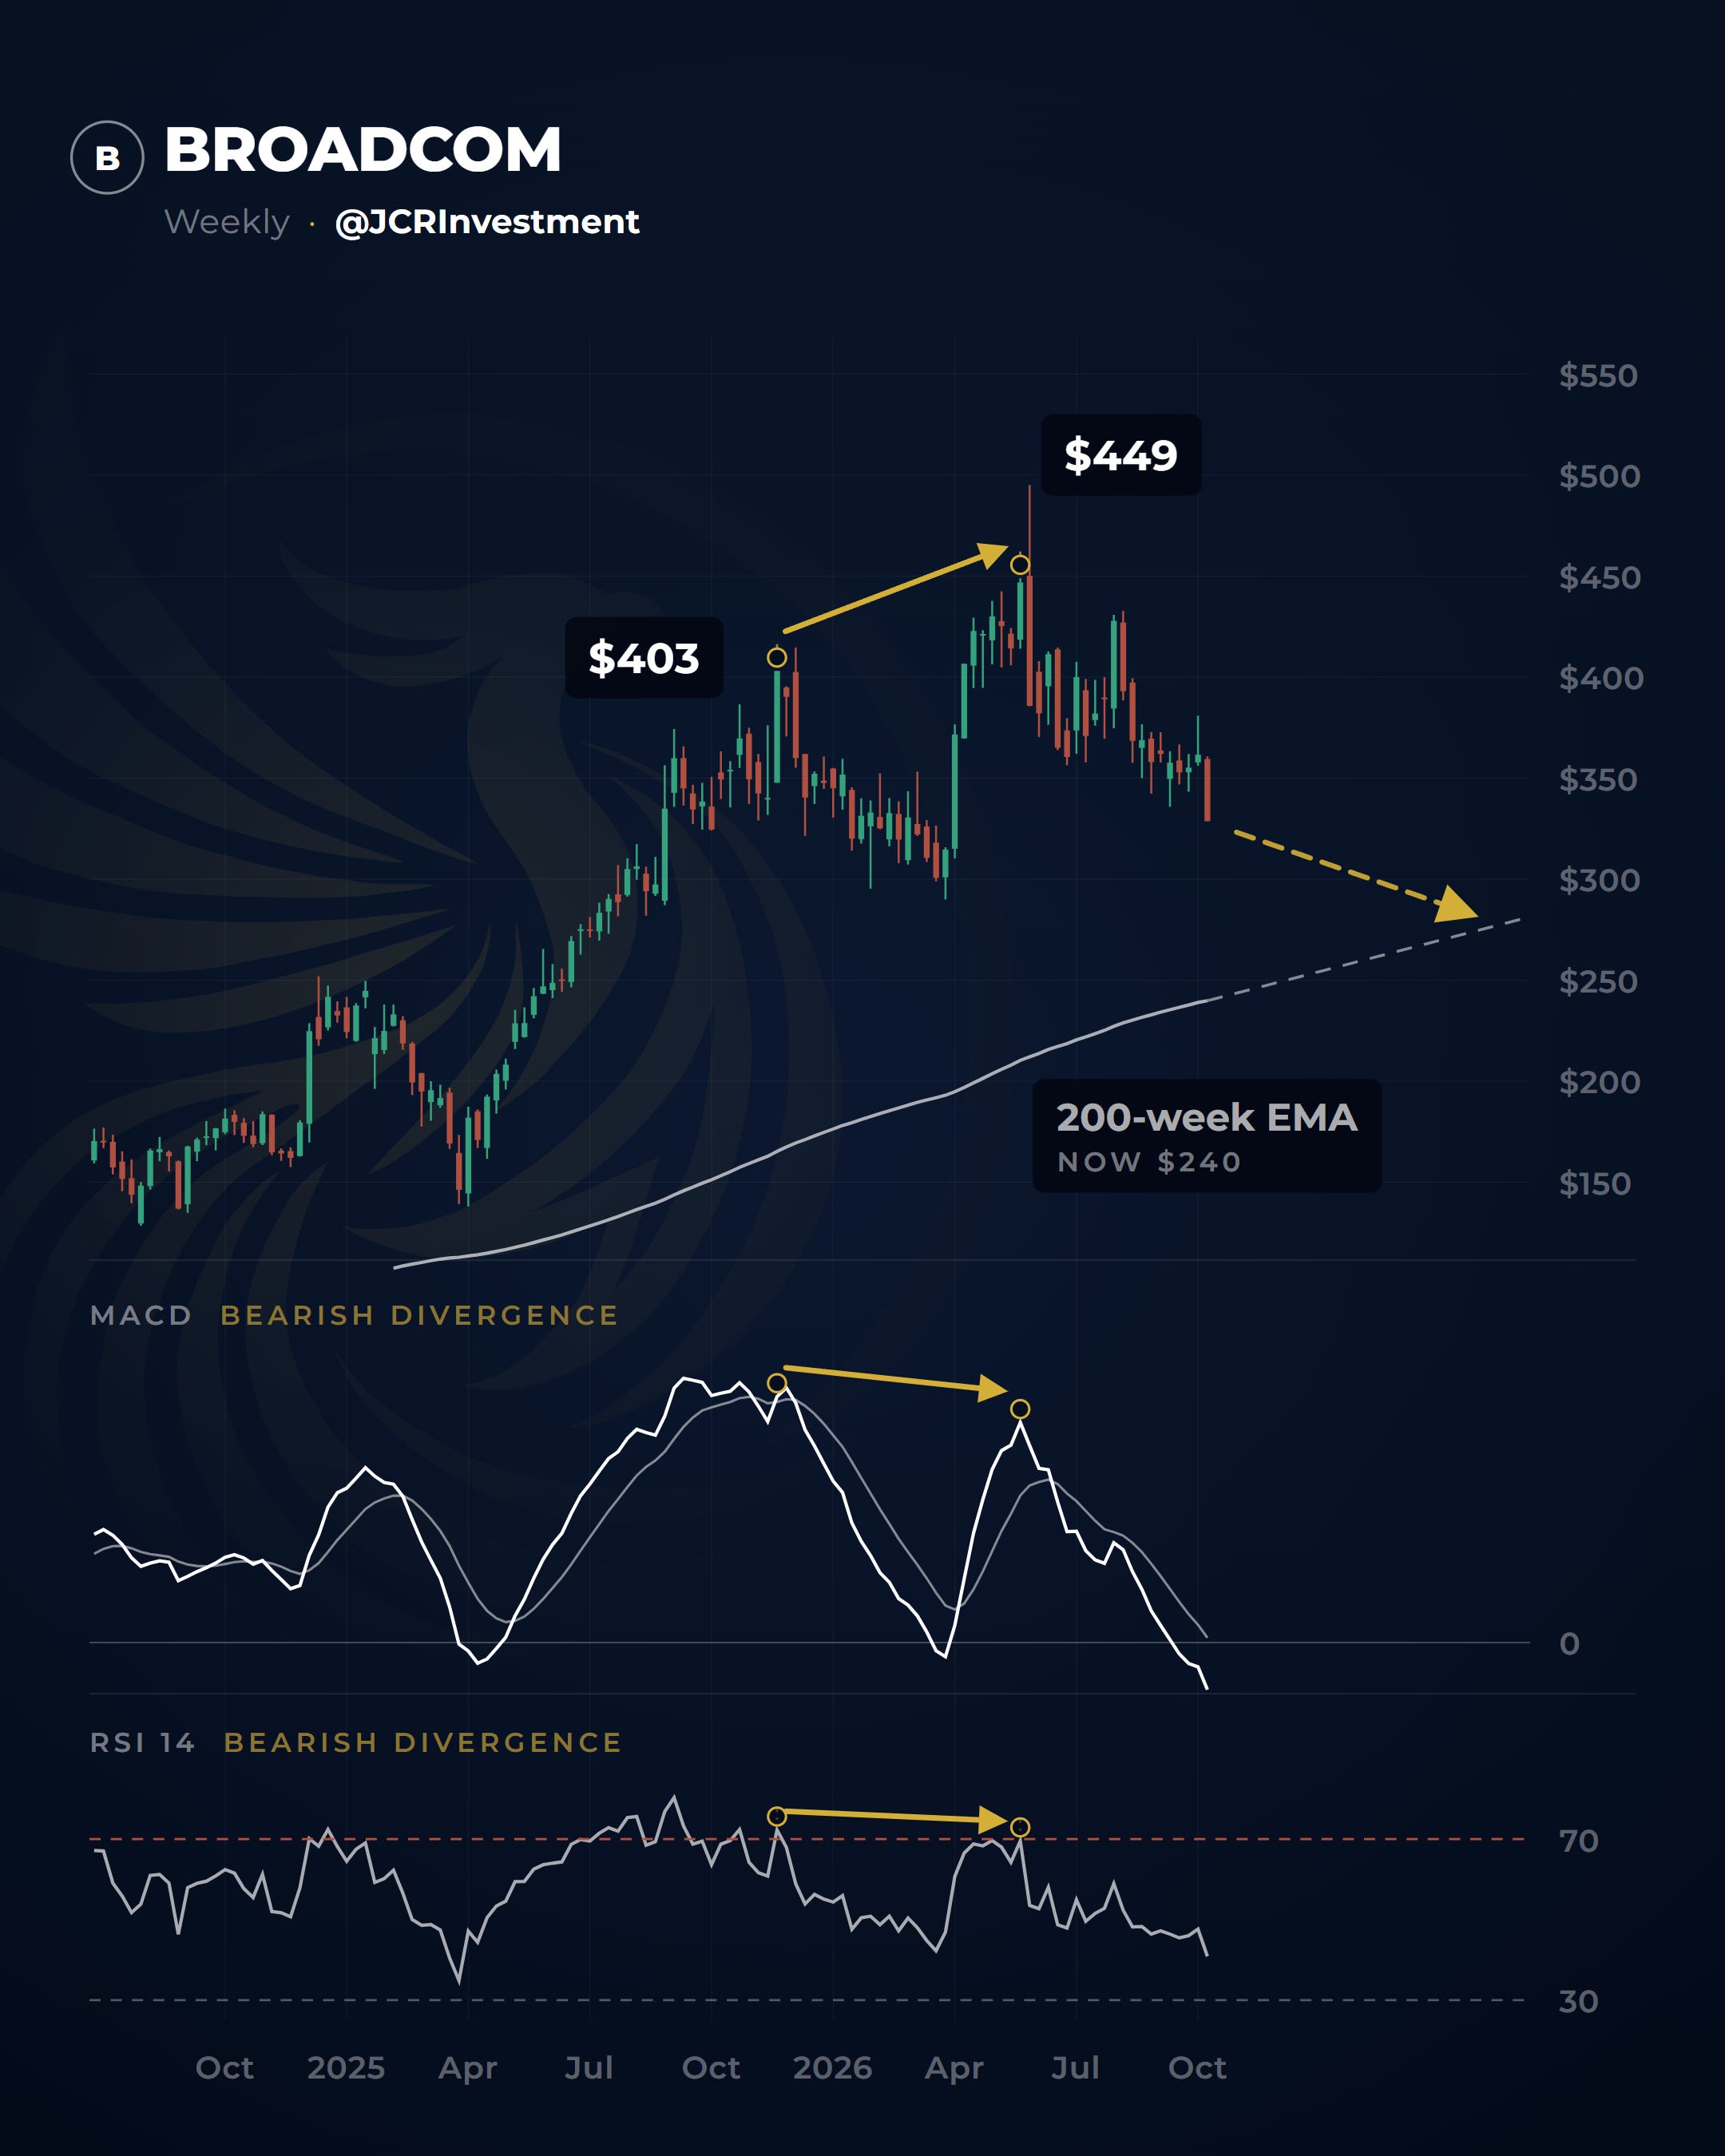
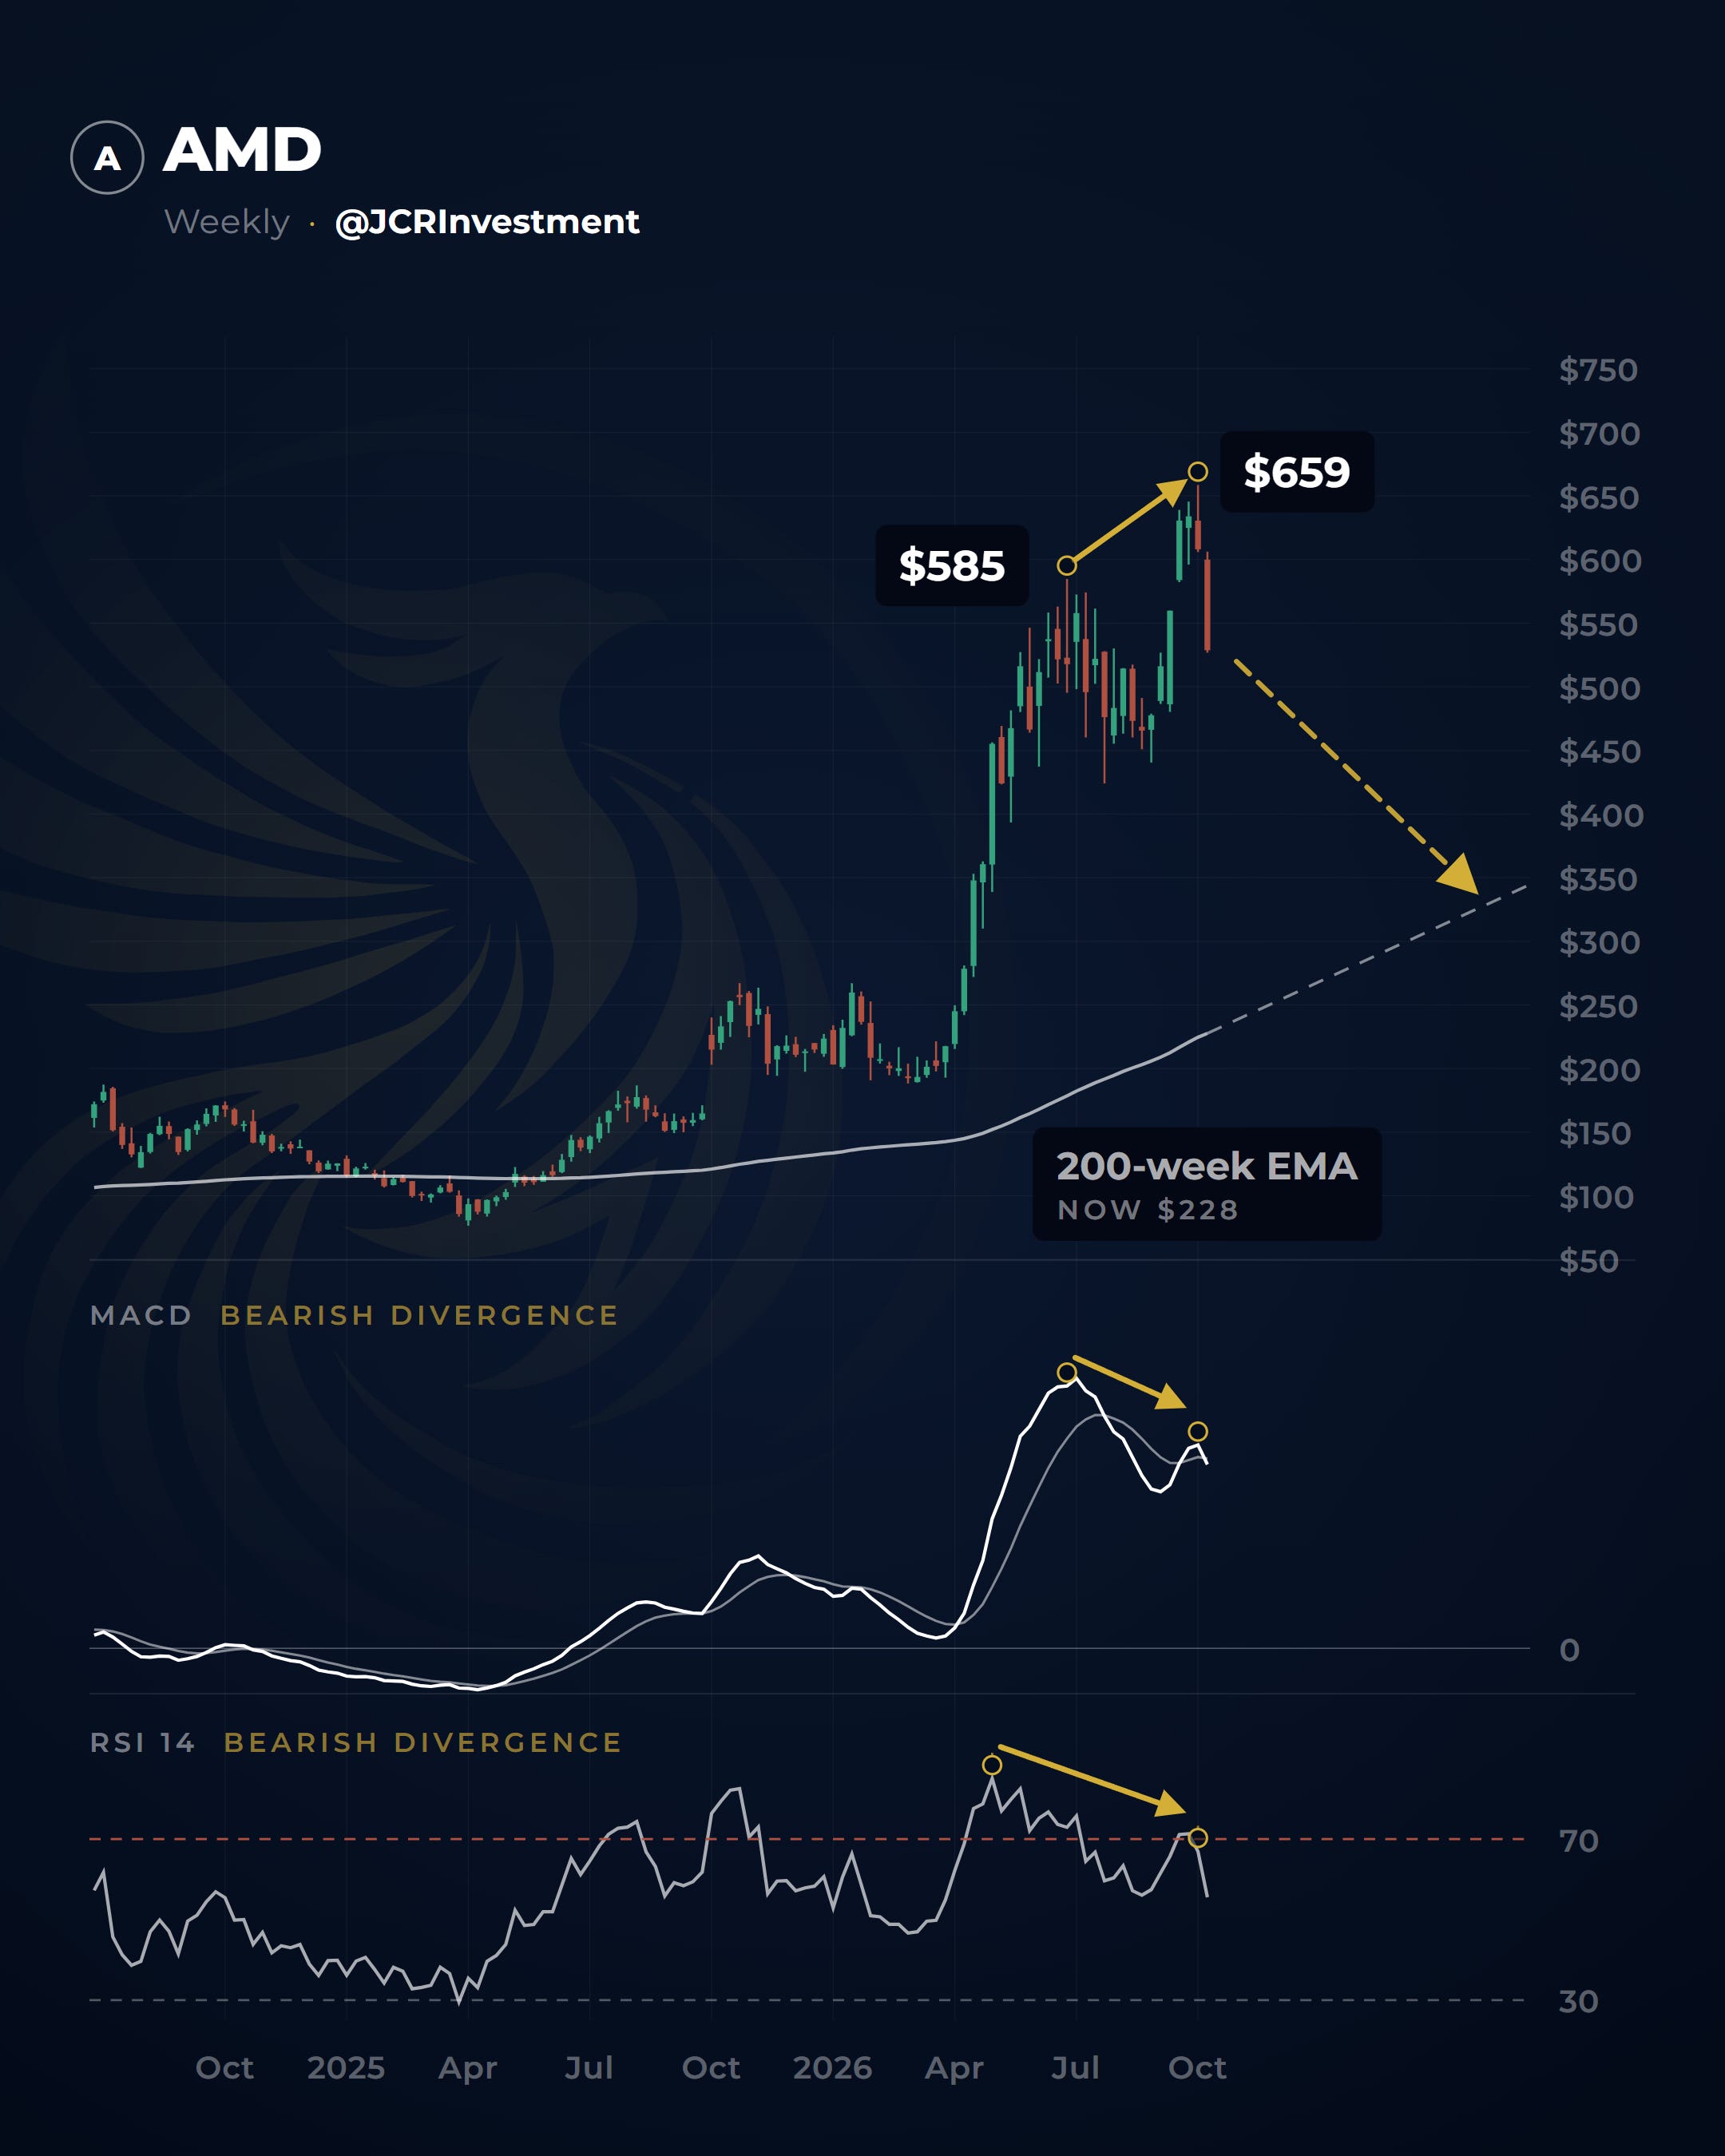
I think this speaks for itself. It’s not just the indices showing correction signals, it’s their leaders too. And it follows the classic chain, leaders first, then the index.
But what about the S&P 500? Well, this is how its sectors break down.
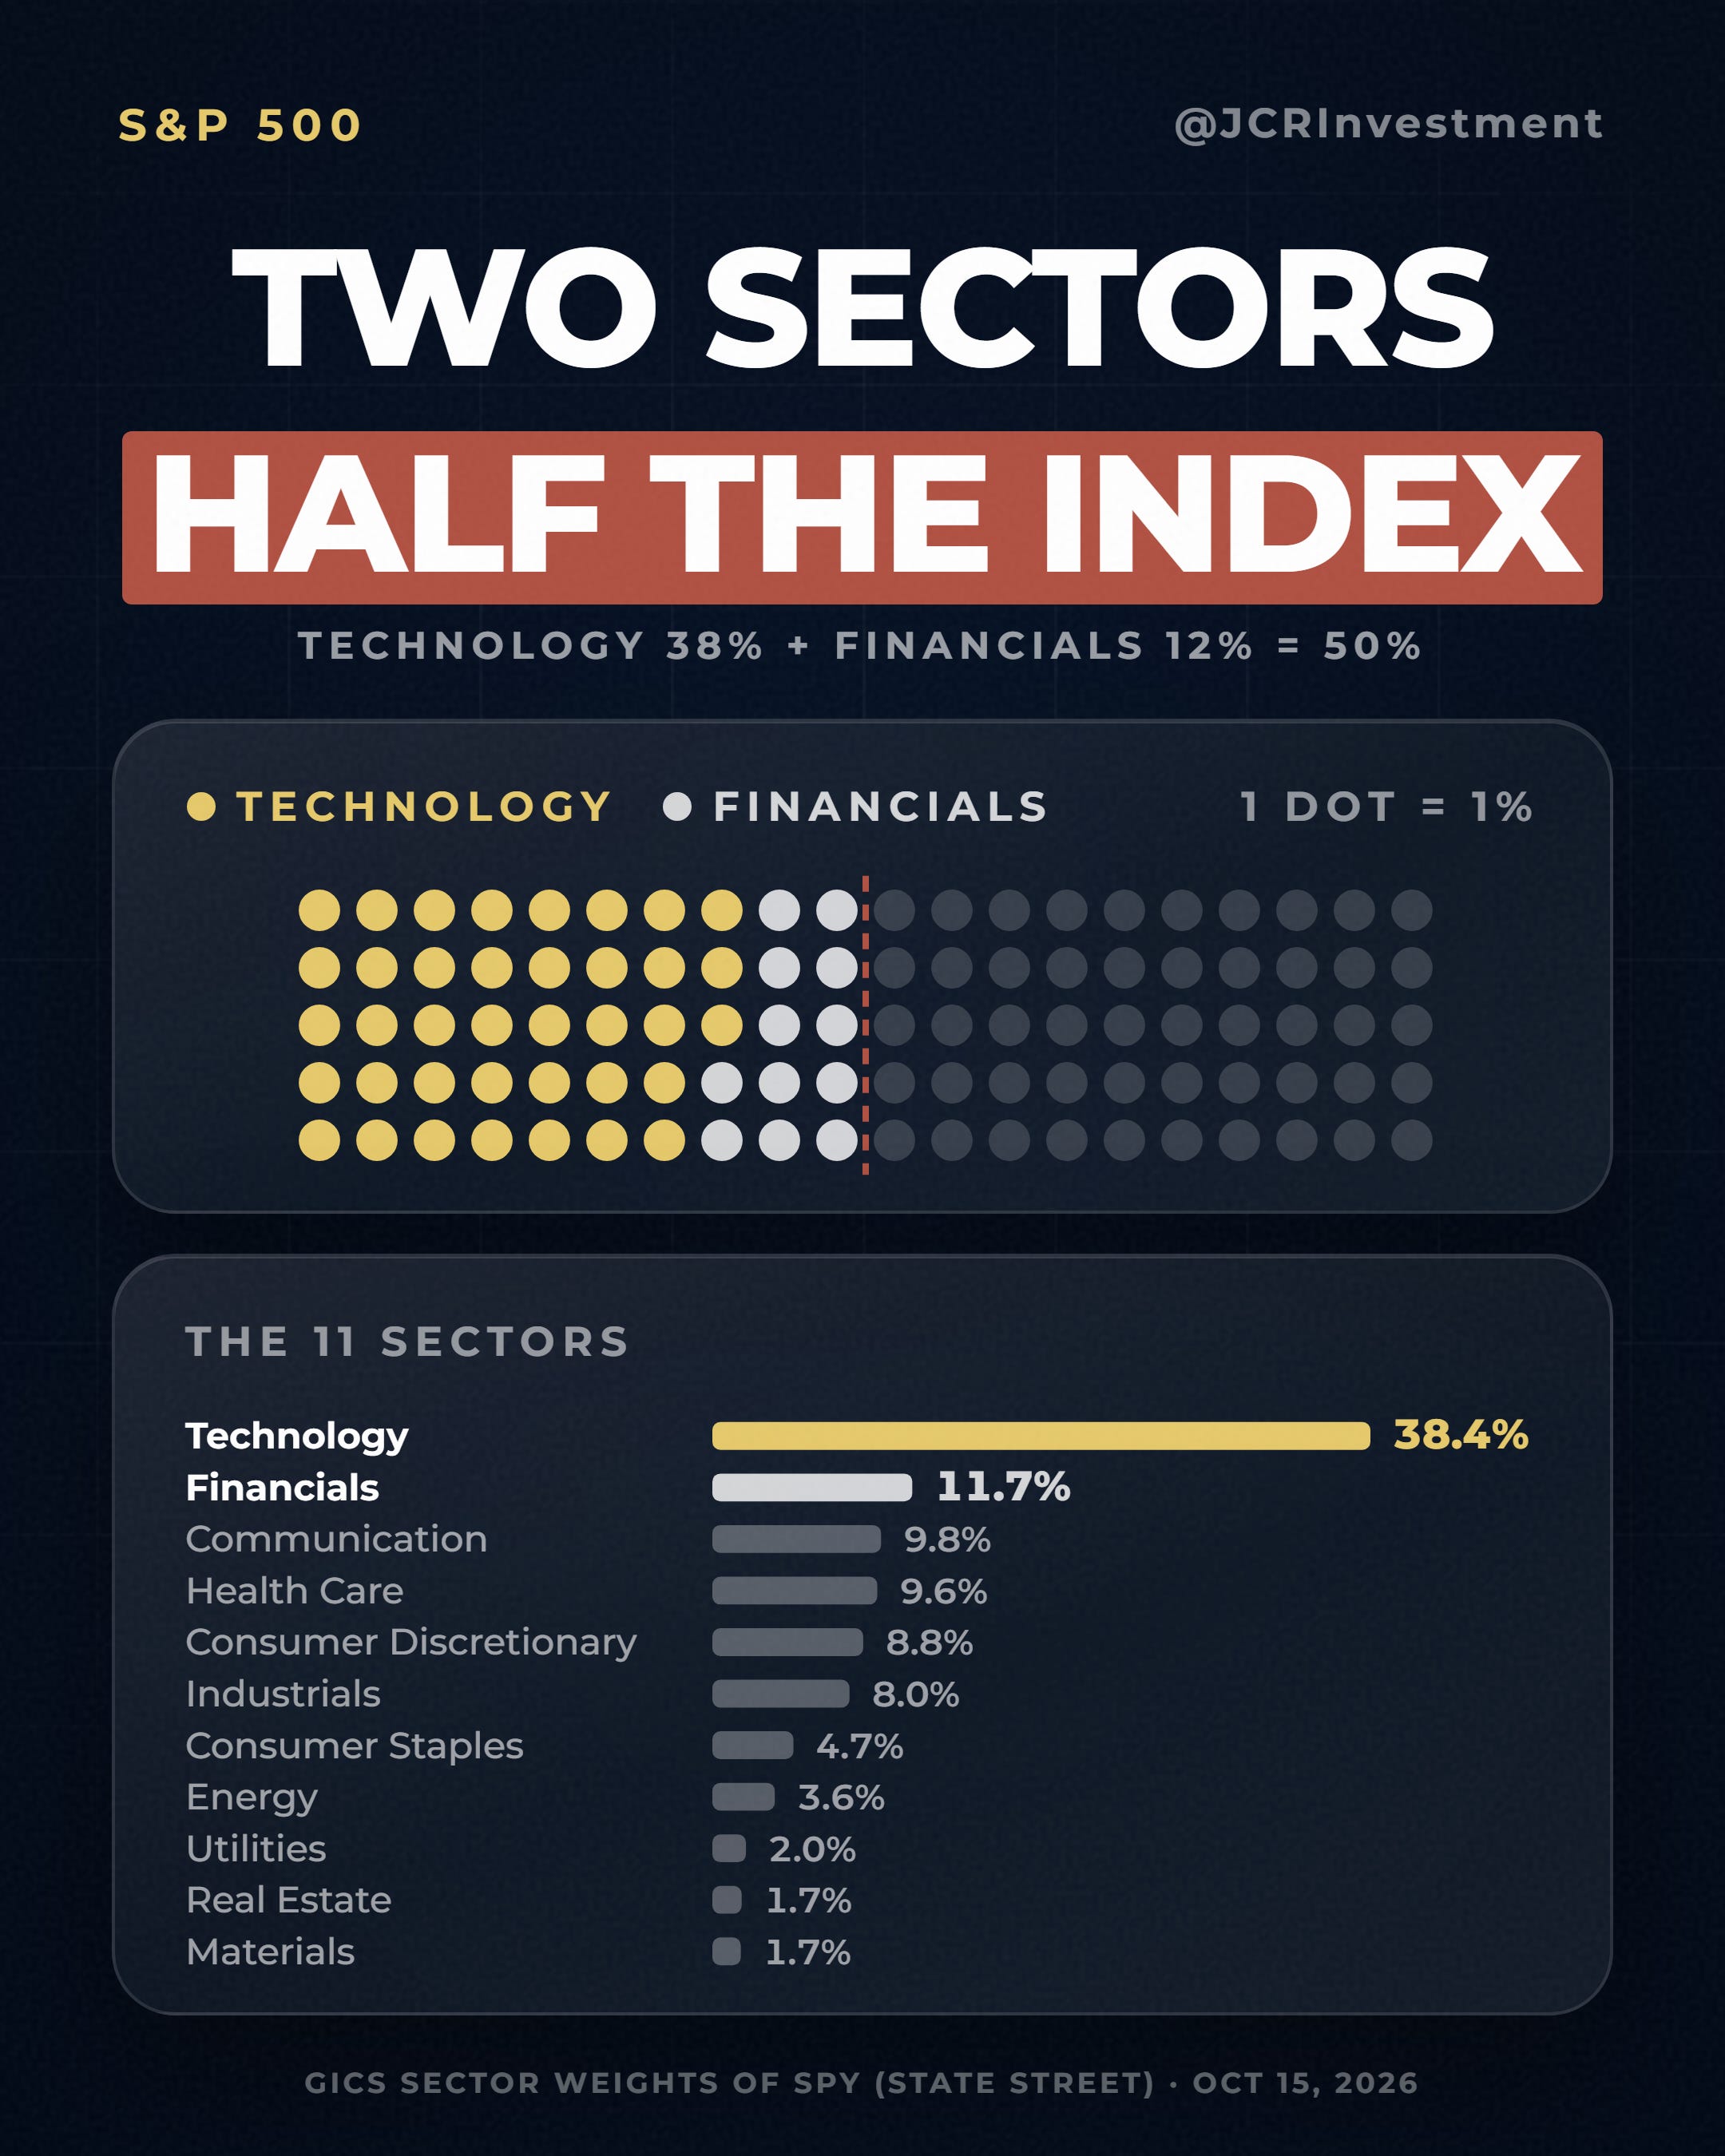
We’ve already covered tech, so let’s look at financials. Together, these two already make up 50% of the index.
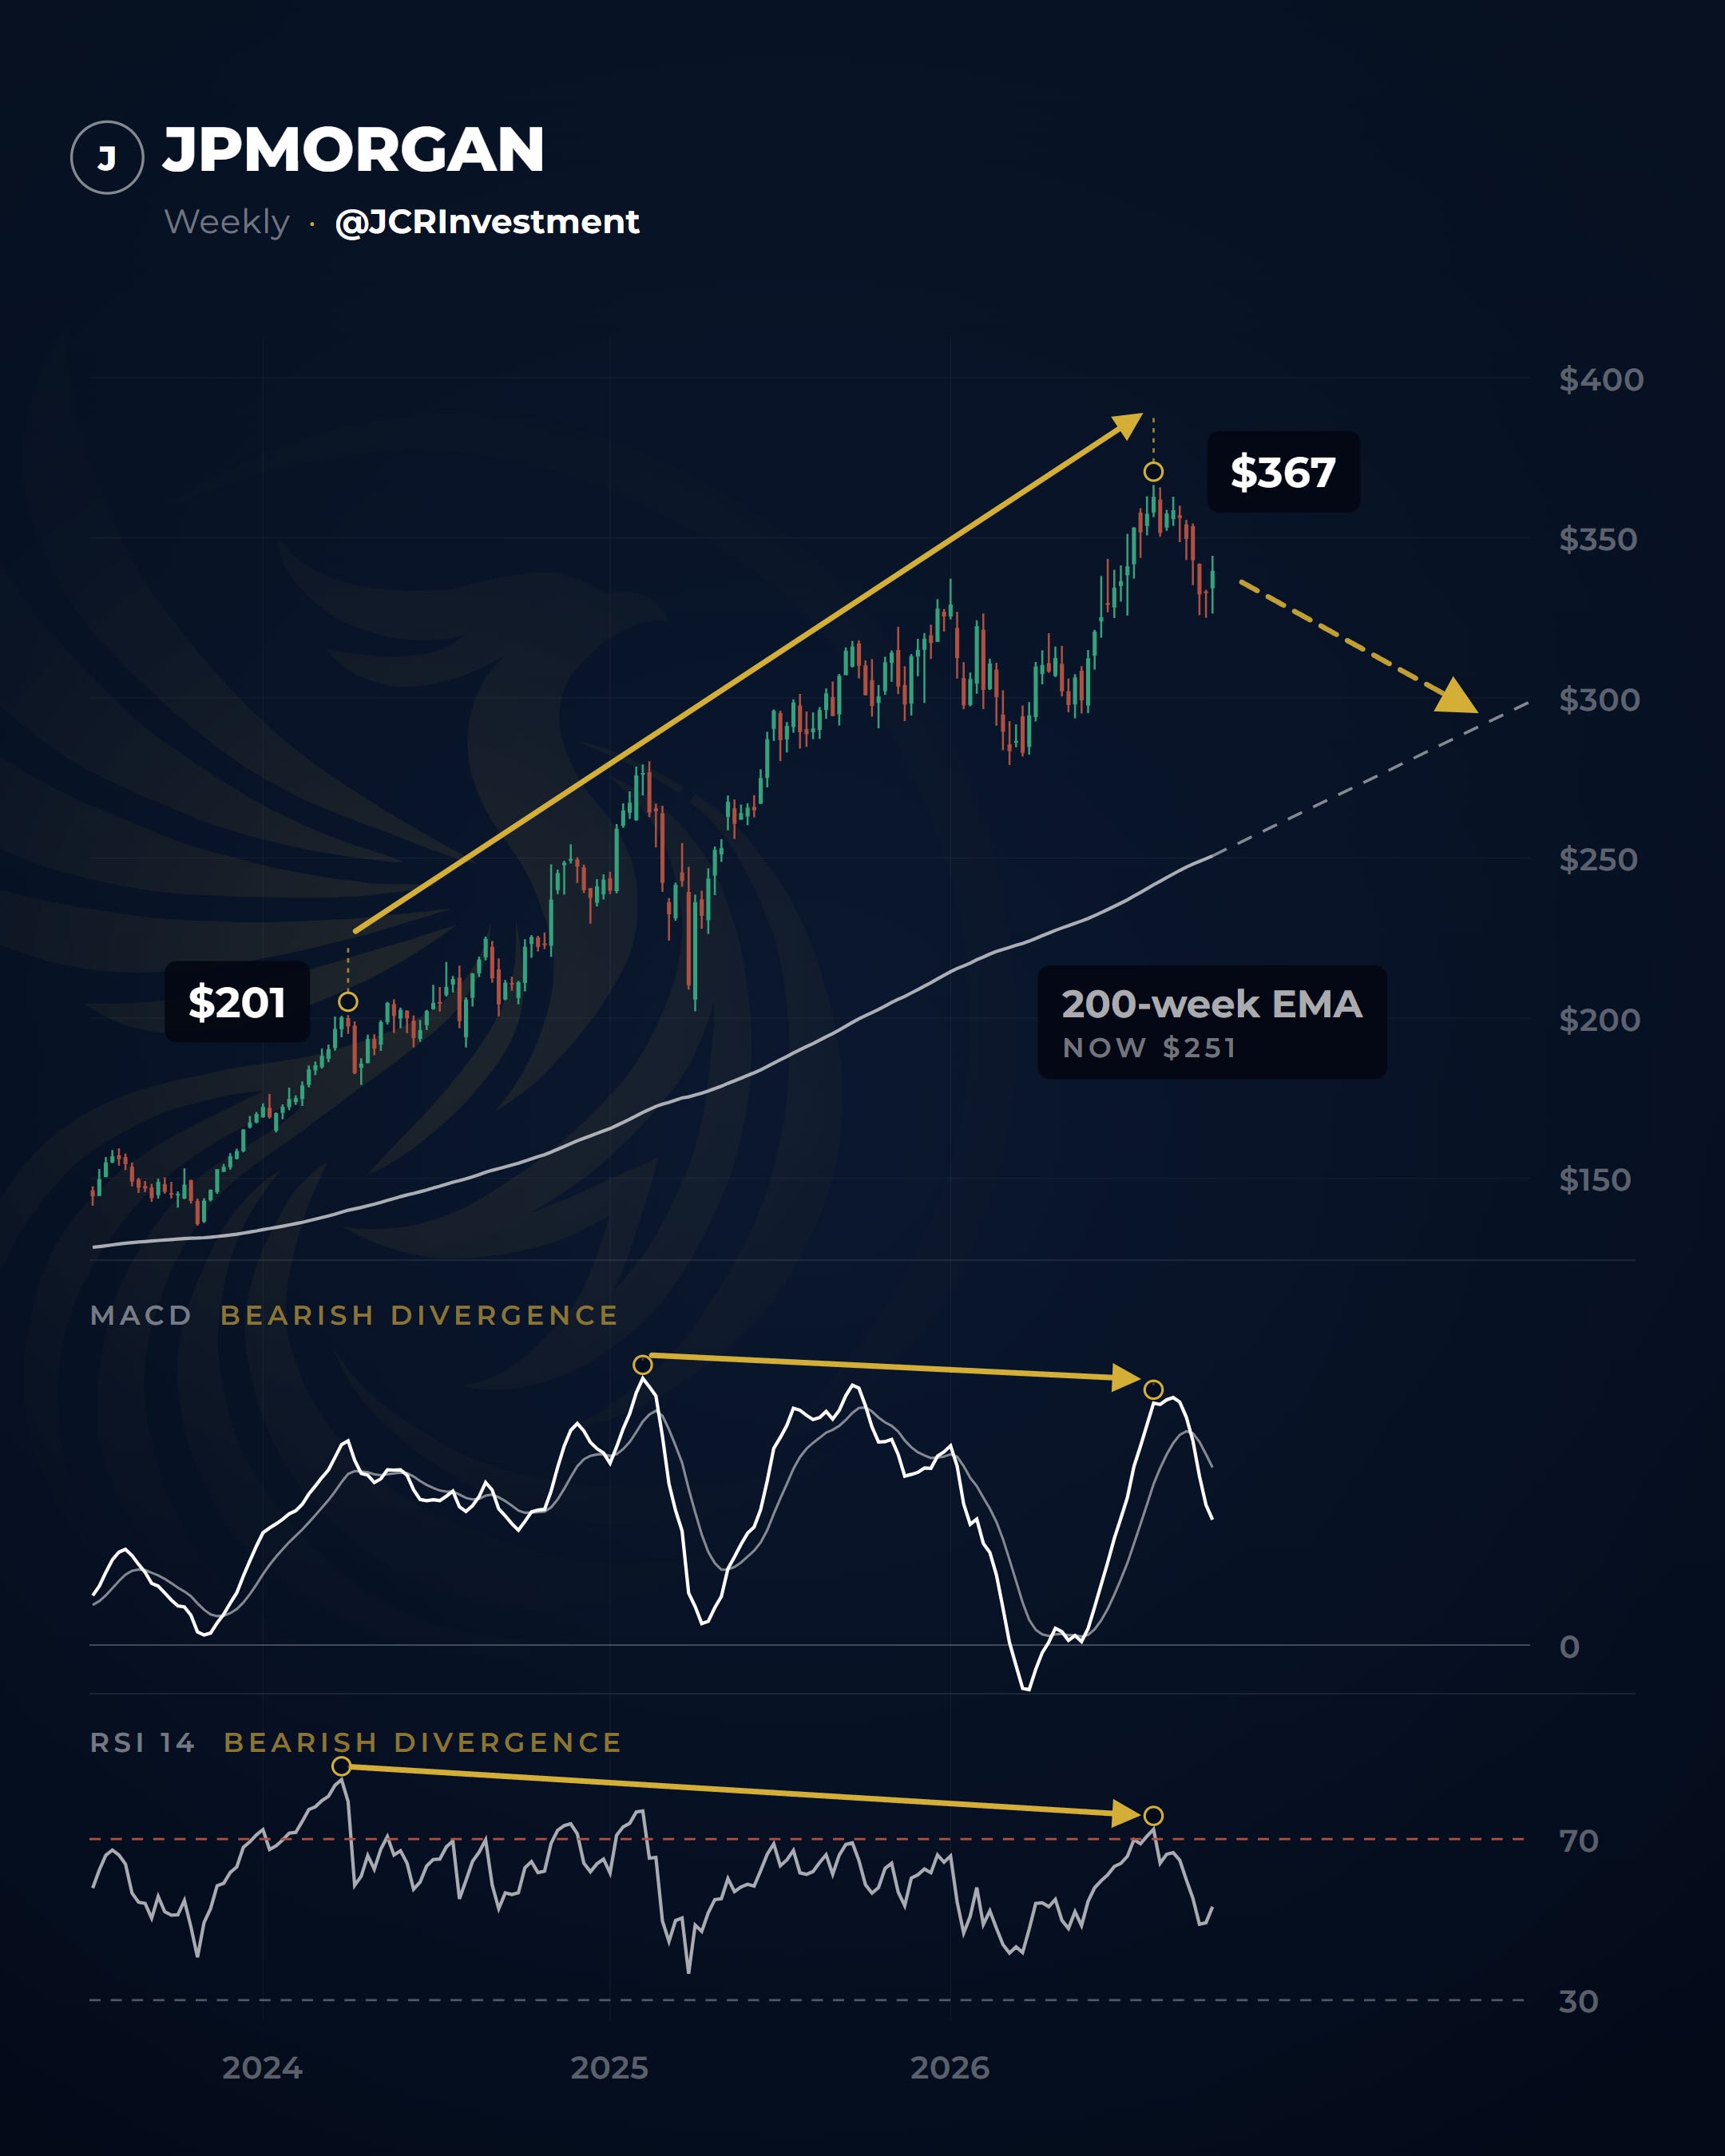
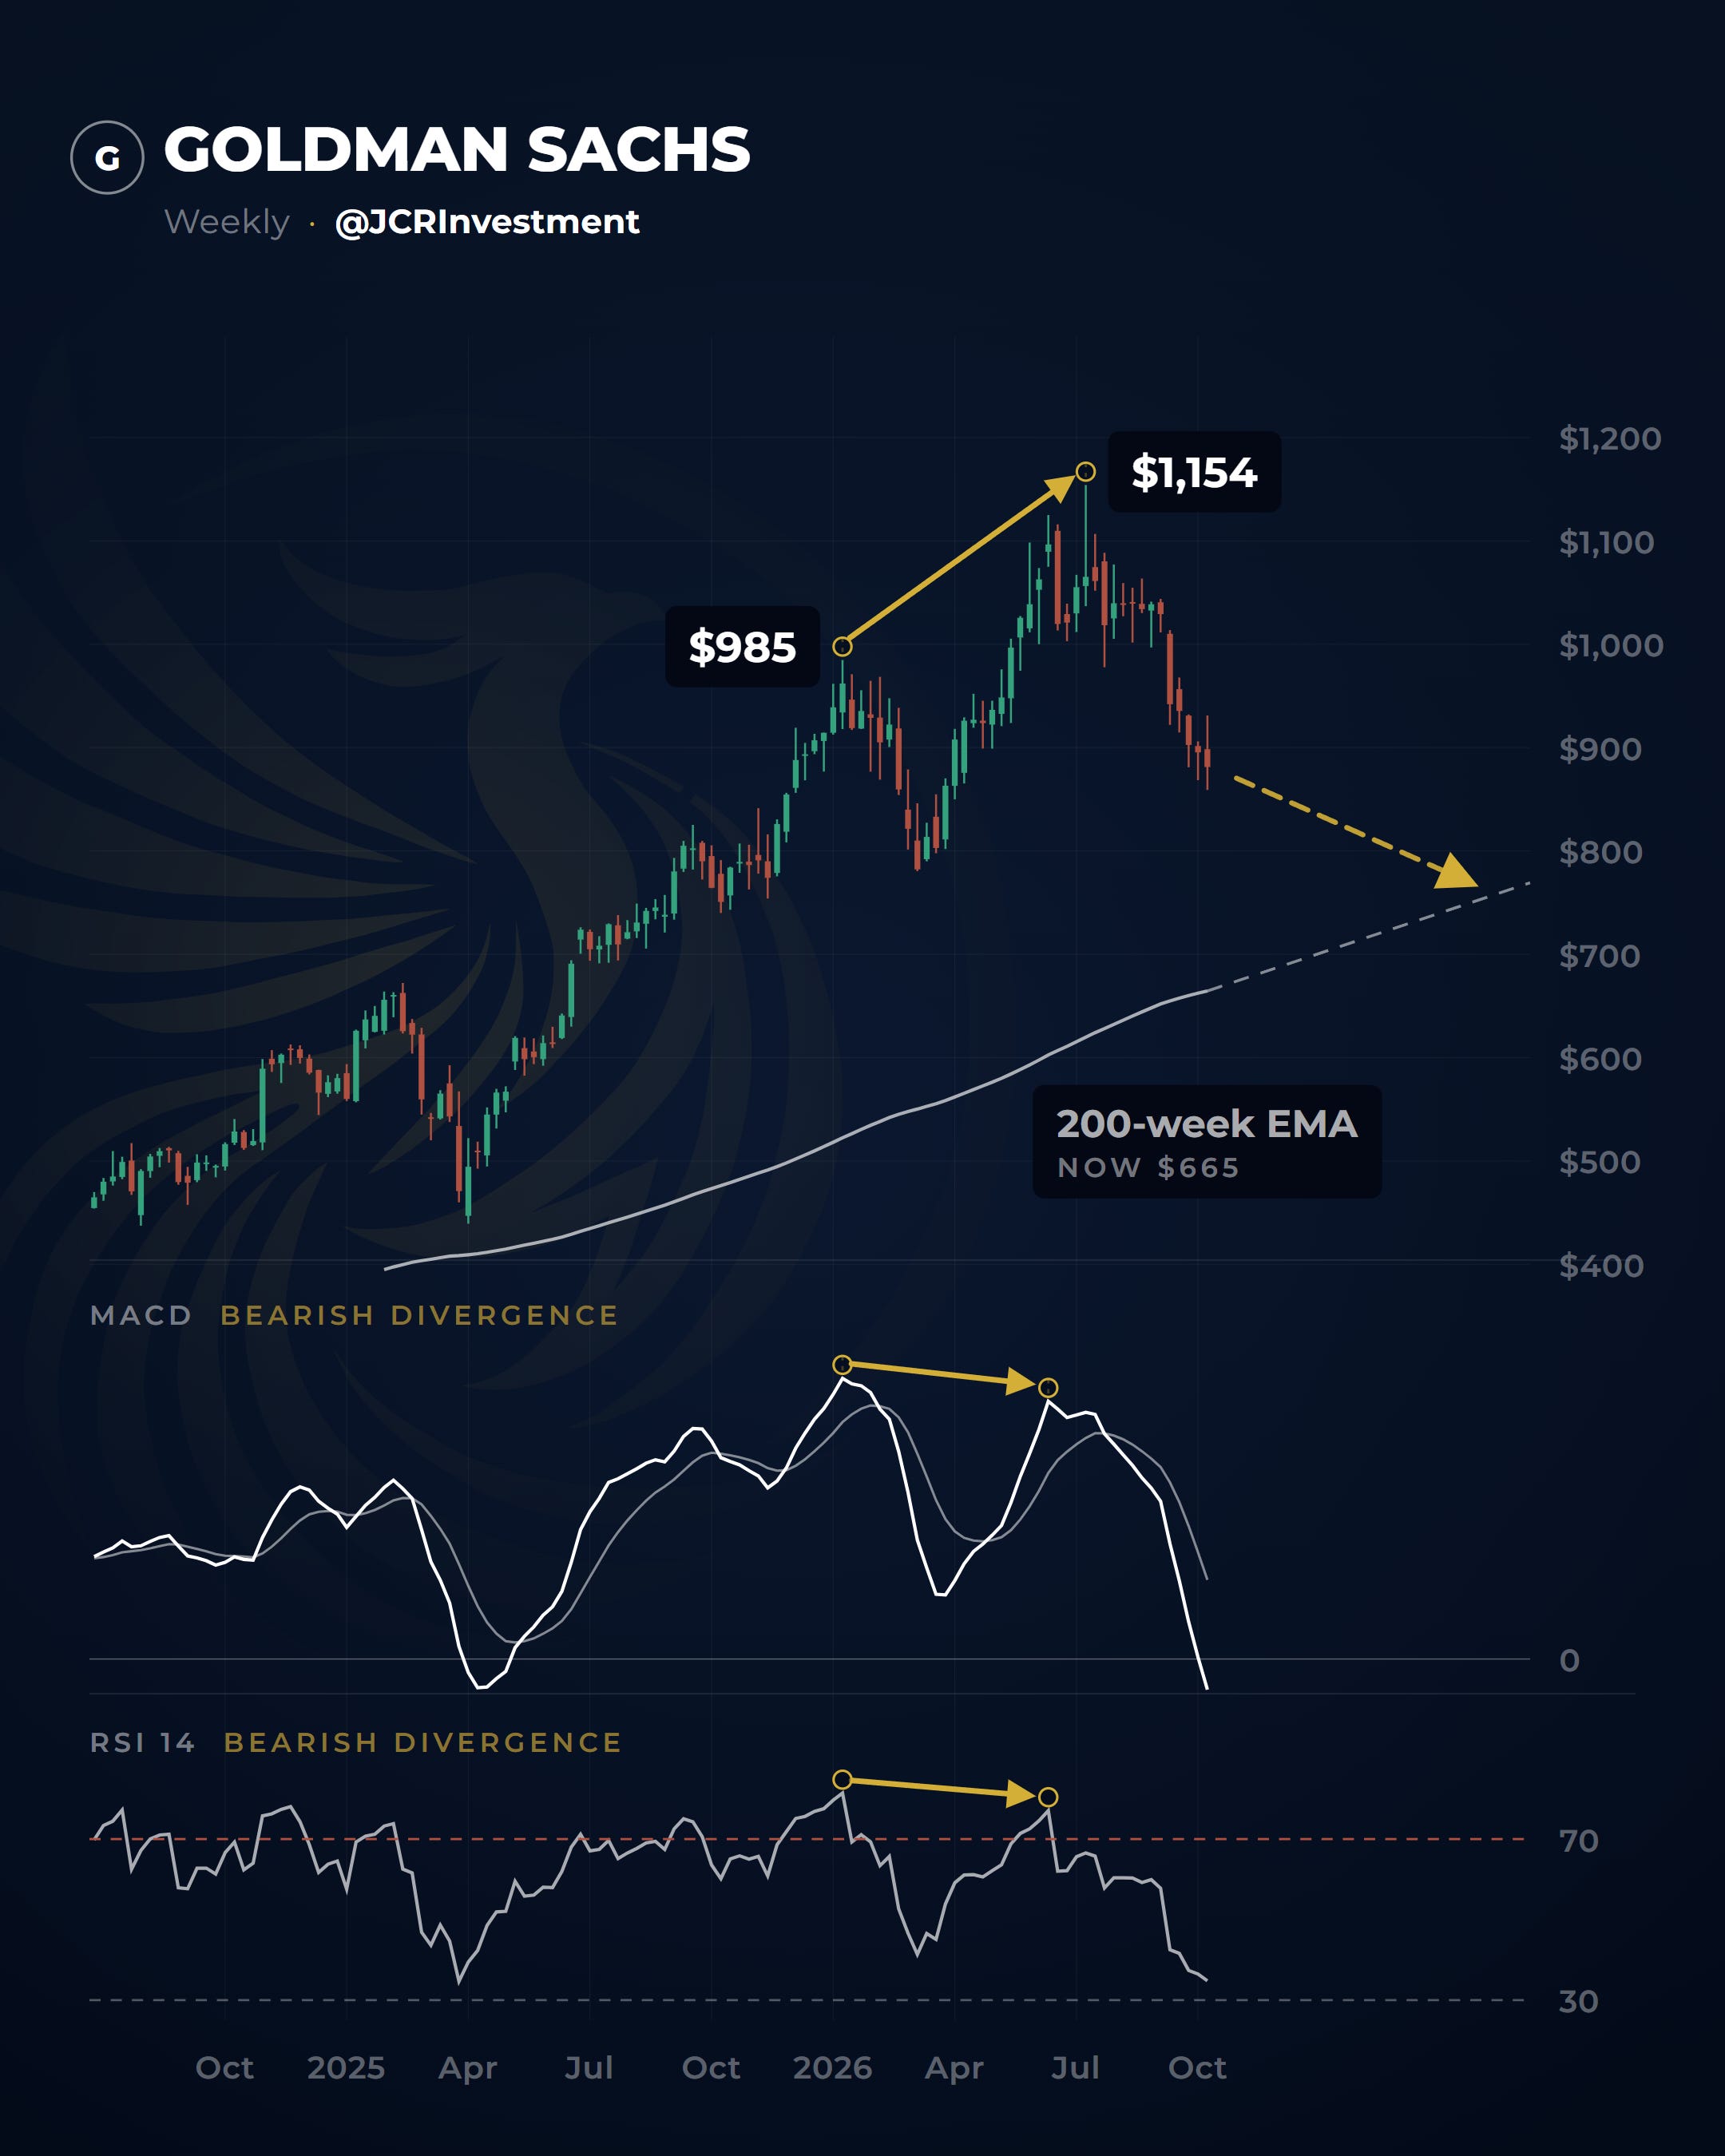
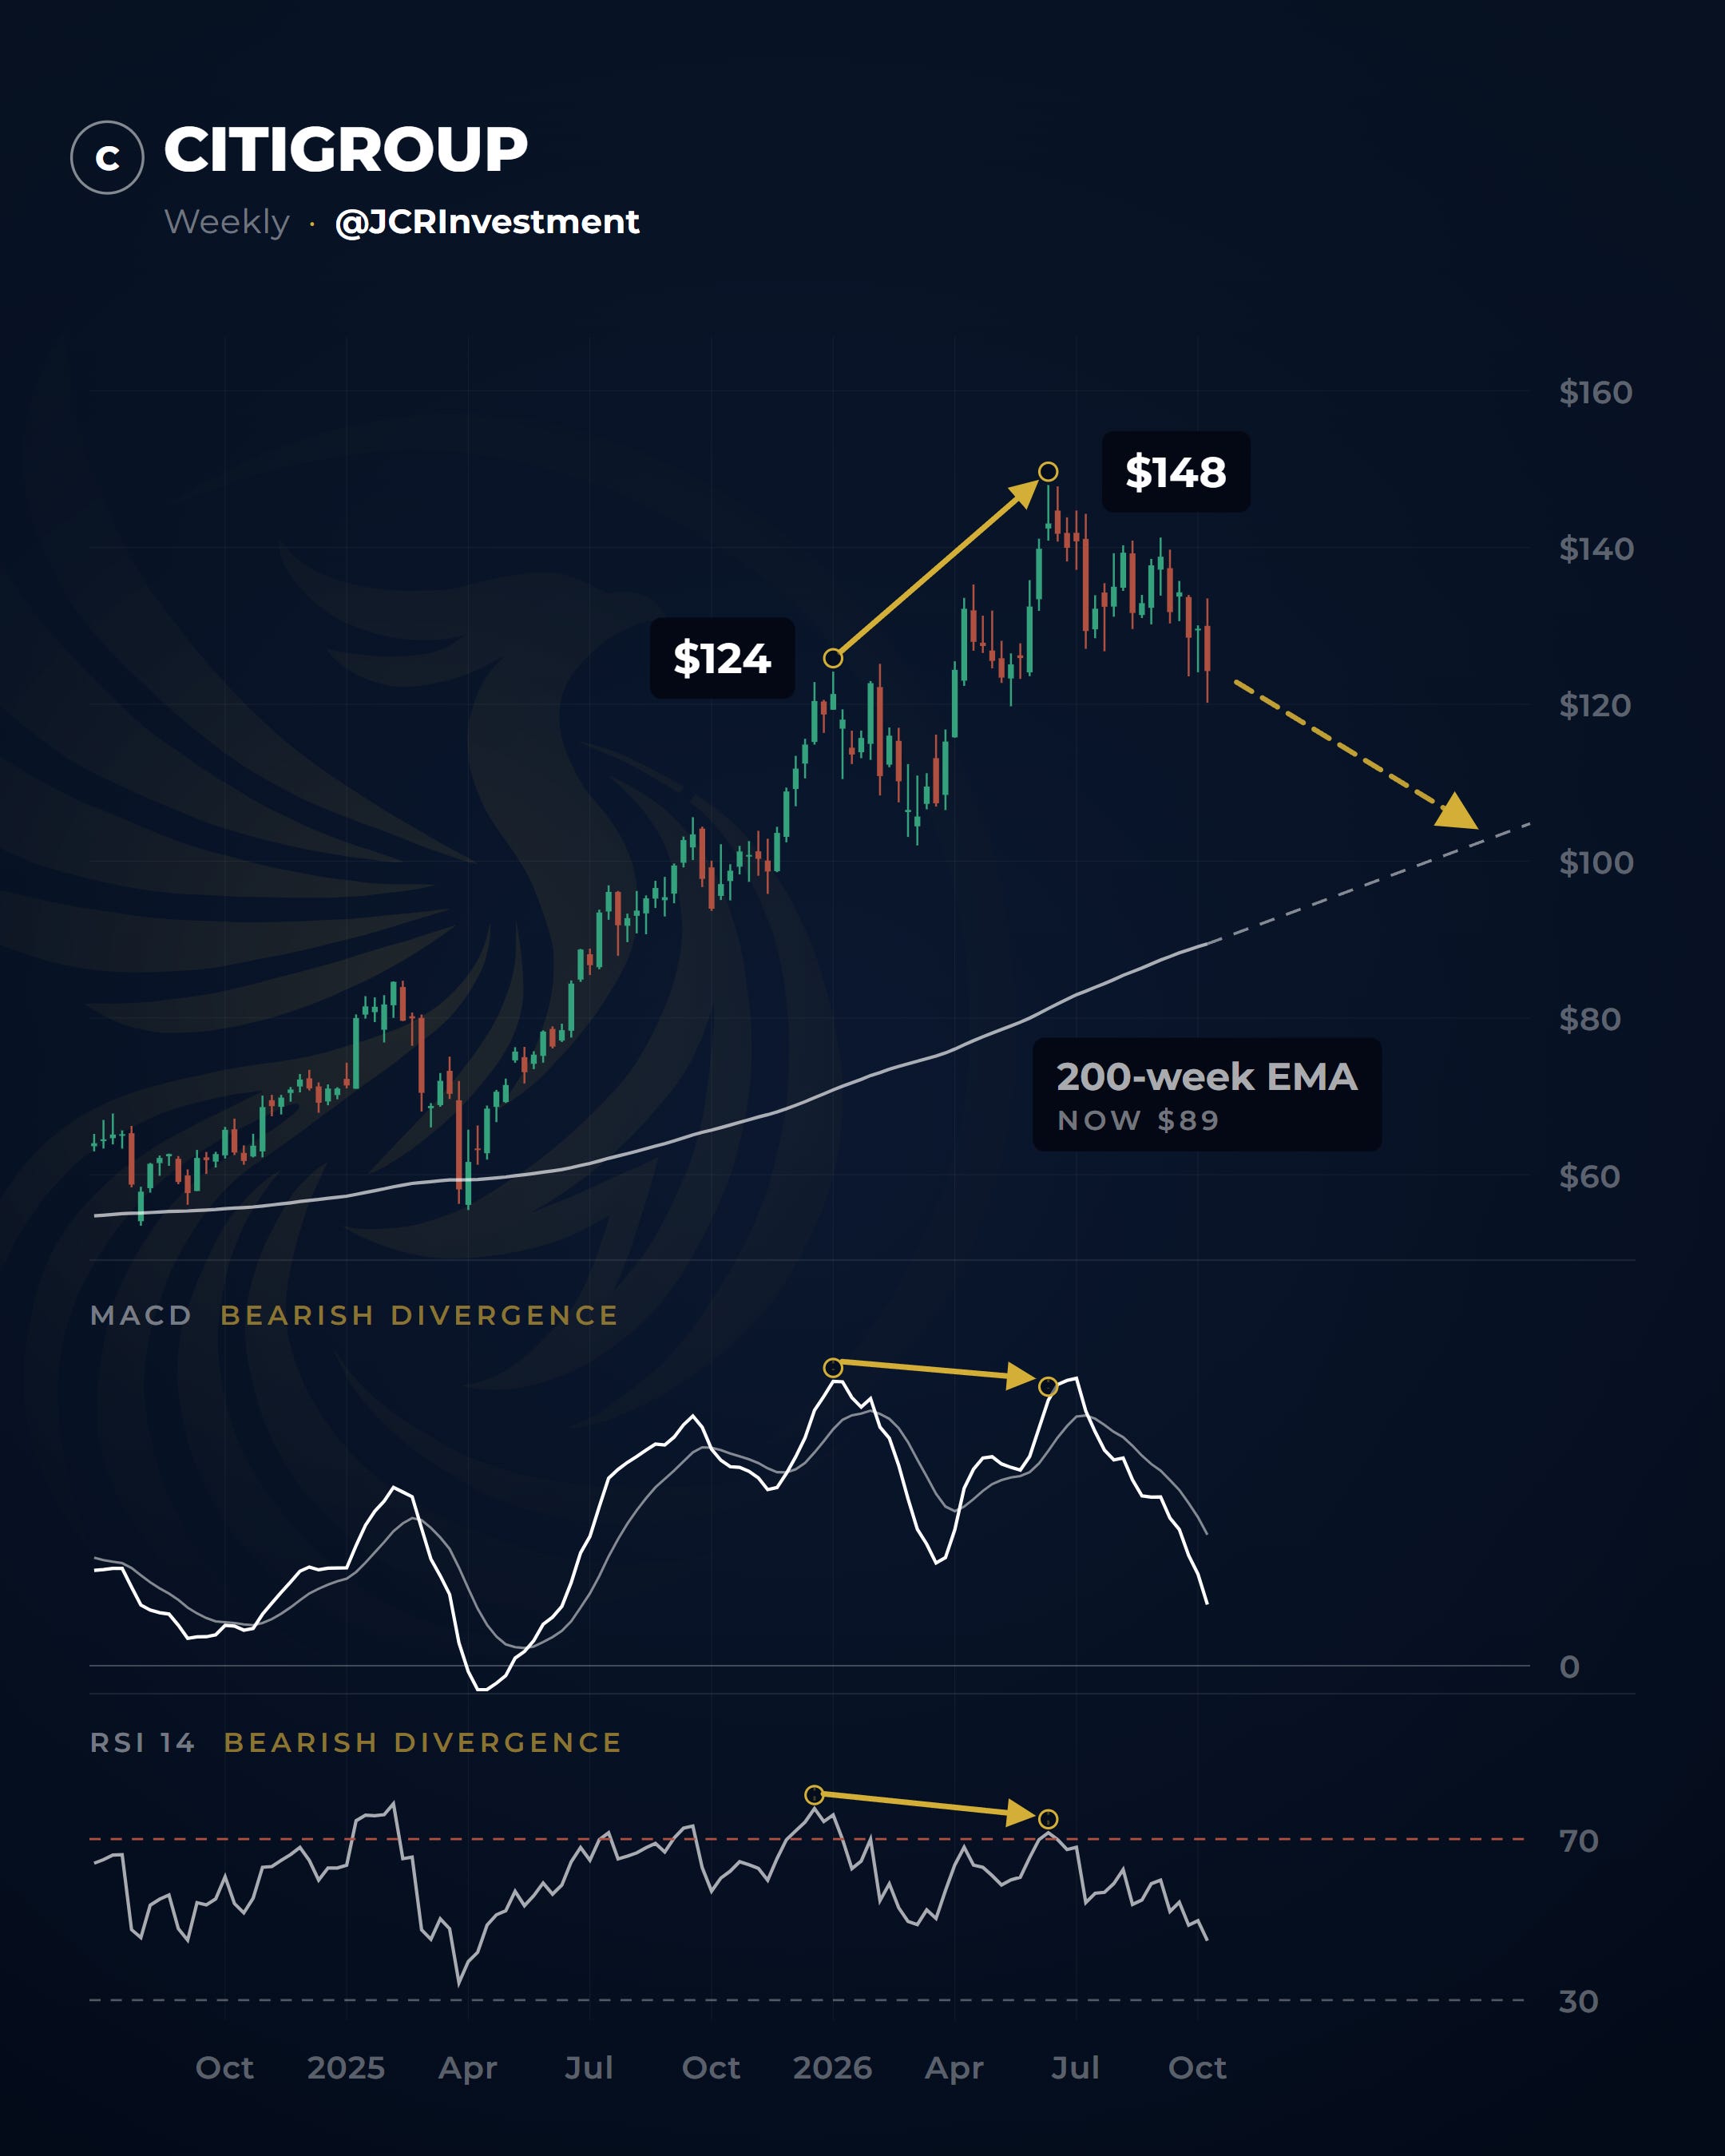
Once again, the same signals are showing up beneath the surface. All of them point to a drop similar to the 22% on the main index. Everything points to a correction down to the weekly moving average.
Maybe you’re thinking, sure, but this probably happens all the time. Look, I’ve been investing for 11 years, and the last time I saw this setup was in December 2021, right before the 2022 correction that sent the Nasdaq down 38%.
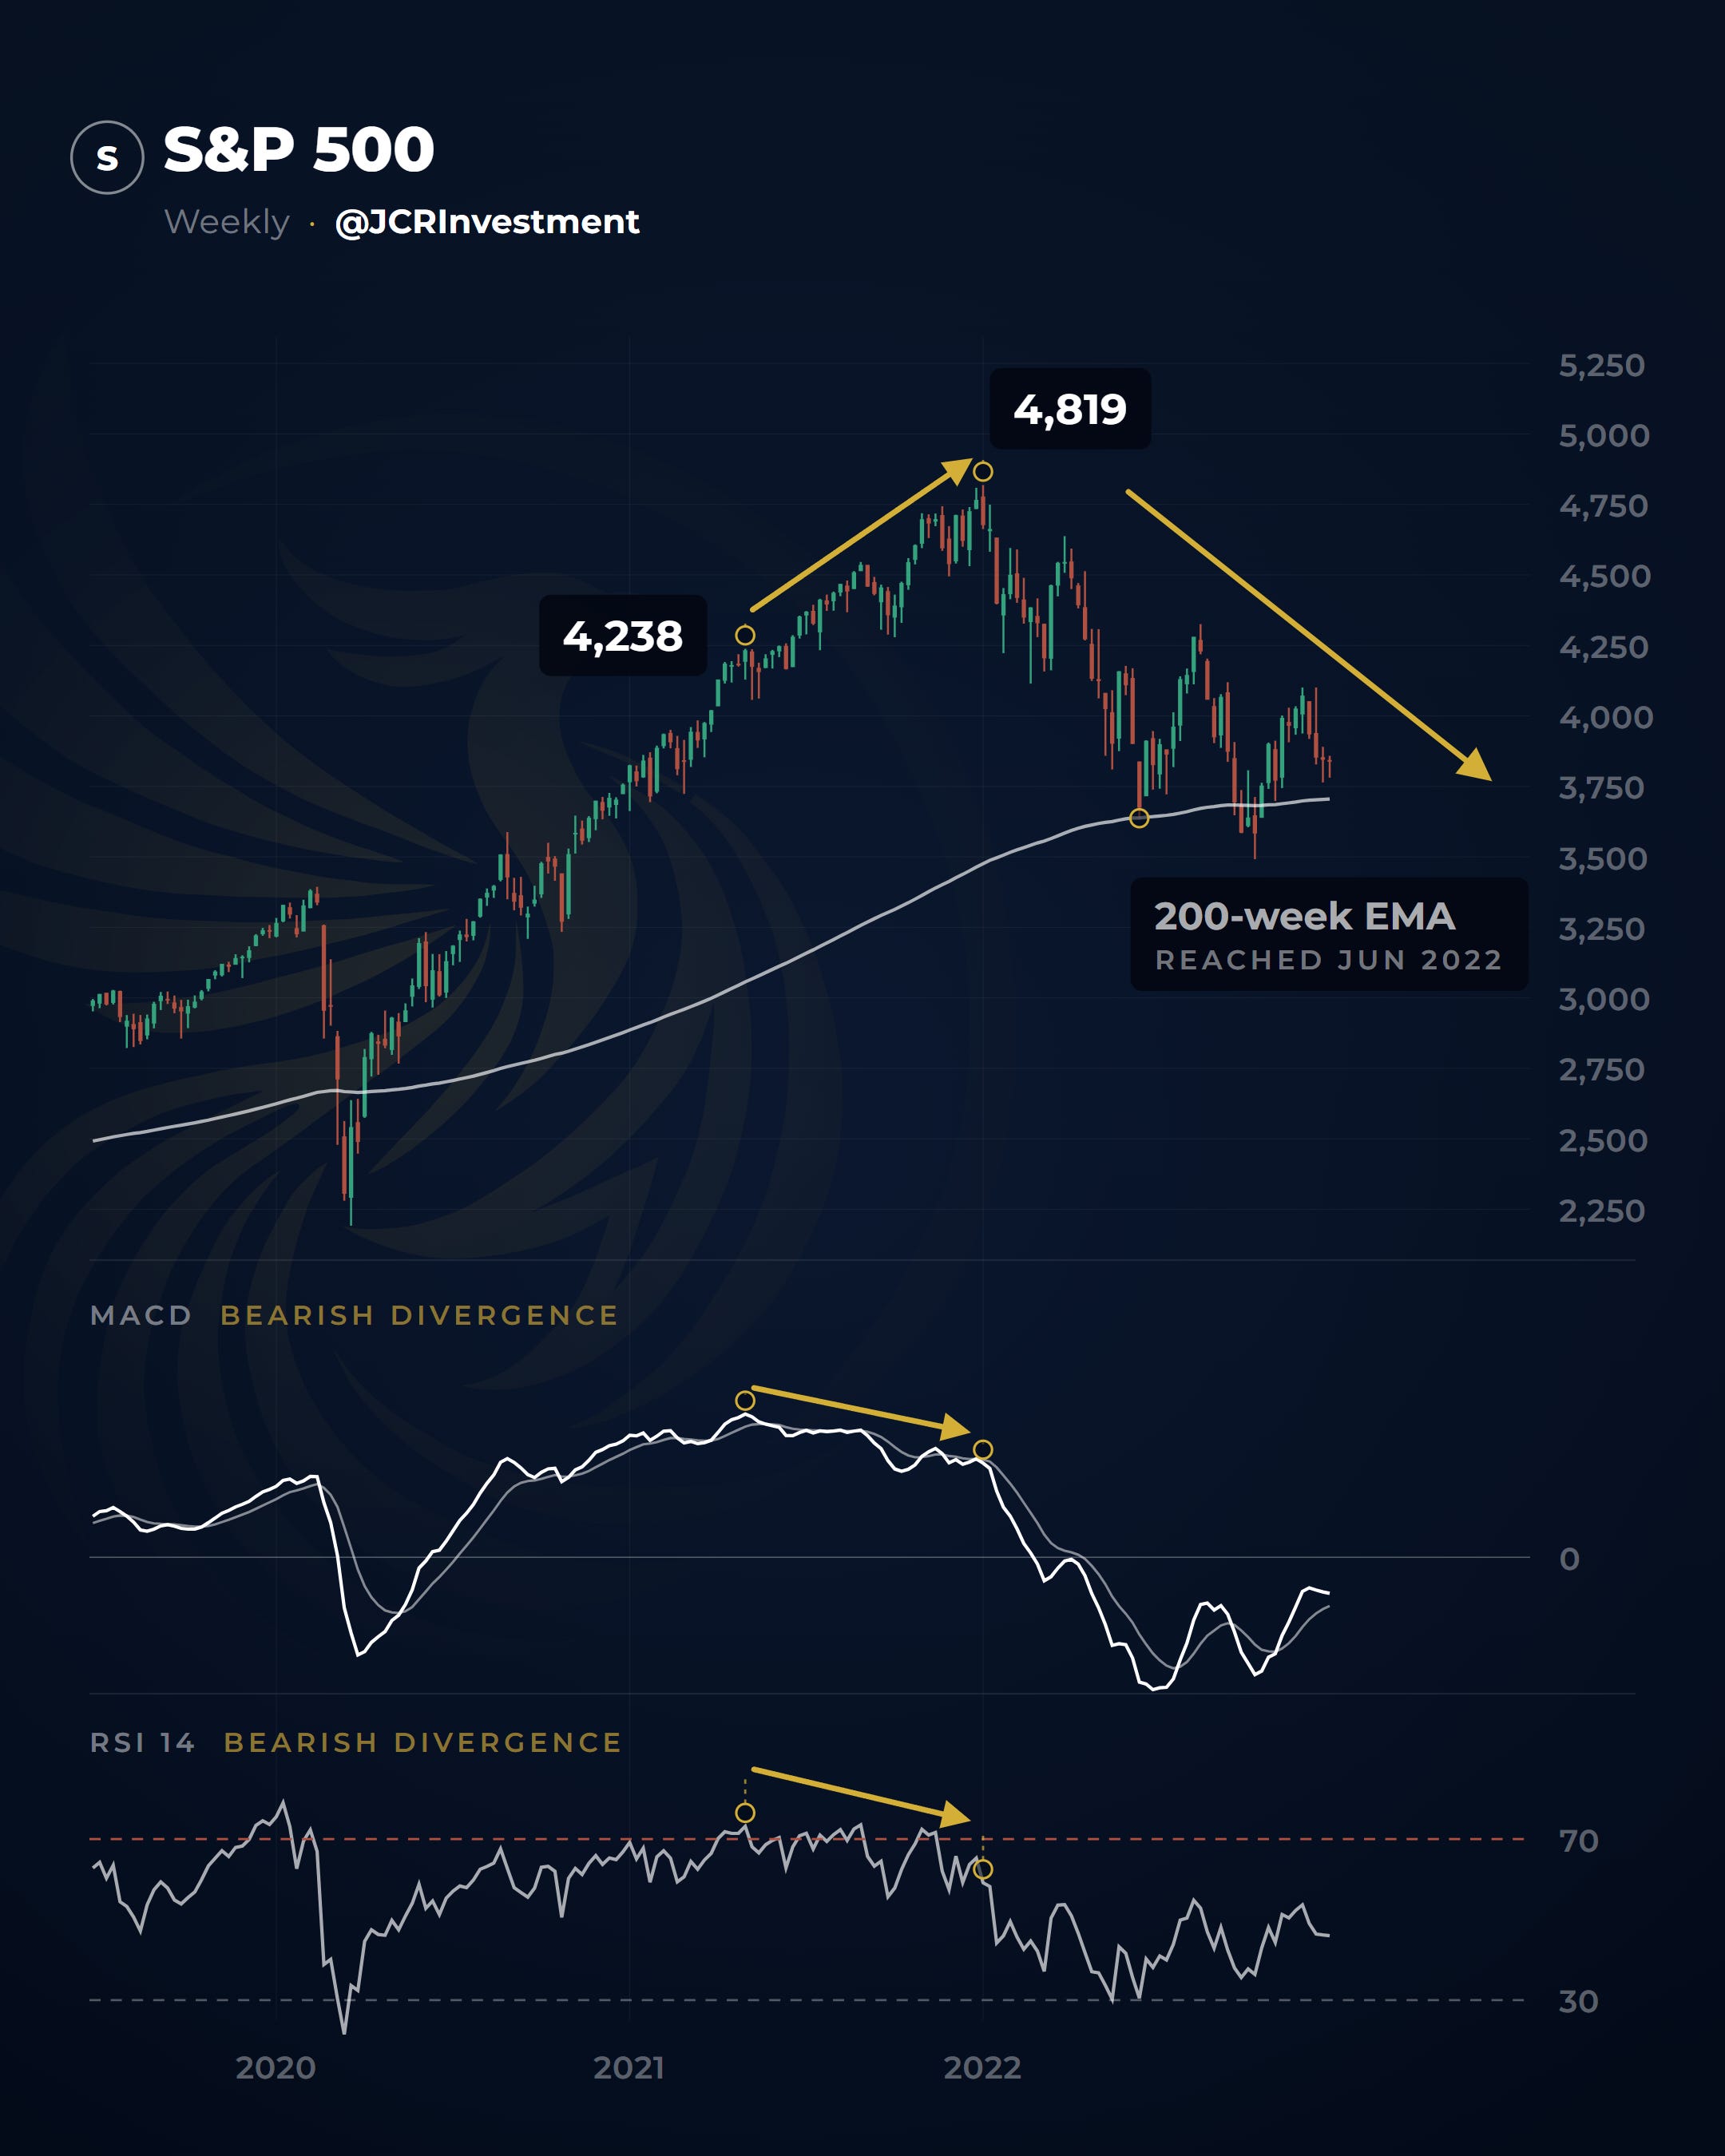
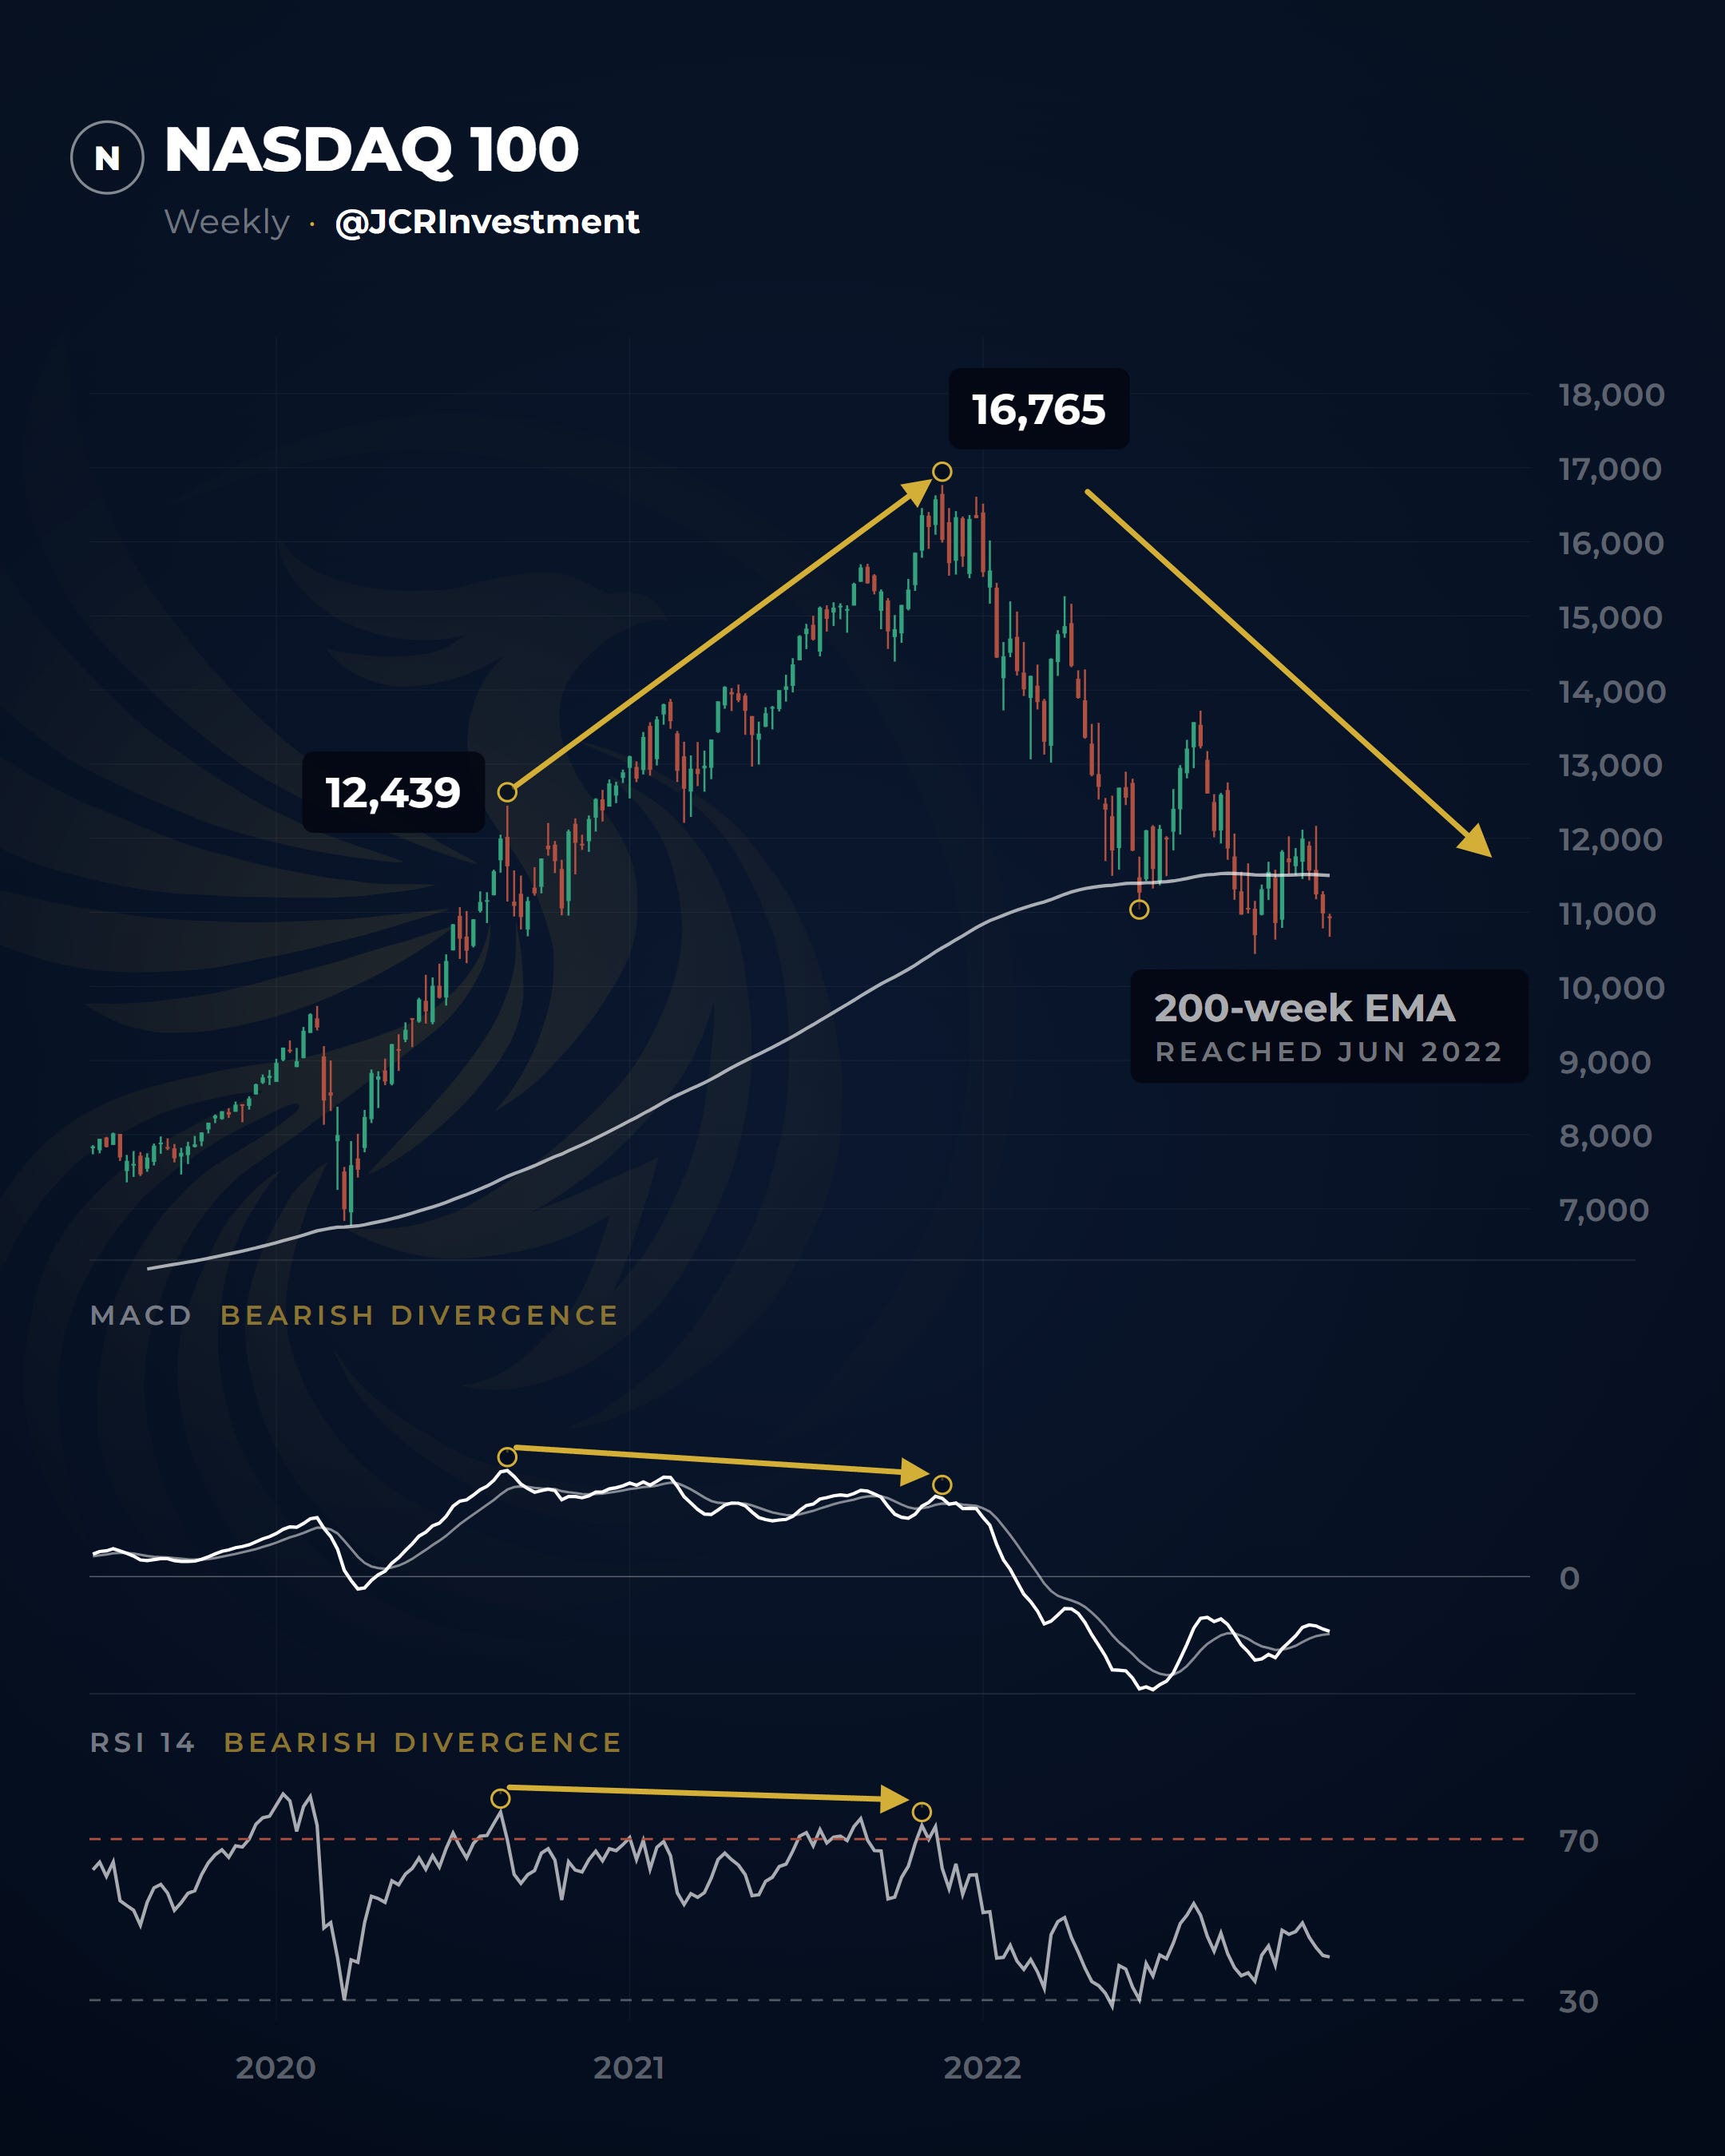
That time, the correction came with the end of cheap money. Bond yields started rising because inflation had exploded. That forced a repricing in every sector most dependent on financing and trading at higher multiples, like tech.
So let’s look at what the market is pricing in this time, and why all these indices and leading stocks are signaling a correction.
As for why that 2021 inflation happened, the one that caused the correction, we’ll get to that at the end.
3 problems at the heart of the market and the economy
Put simply, what moves markets is the liquidity central banks pump into the economy. A lot of people say earnings move the market, and that’s true, but liquidity is what moves those earnings. If the world’s money supply grows, earnings naturally go up. If they start draining it, earnings naturally go down.
Interest rates, which is probably what you’re most familiar with, are just one of the many tools they have to inject liquidity.
And what do they base their decision to inject or drain liquidity on? Mainly on paying off governments’ exponential debt, but also on inflation and the economy.
As one of the greatest investors in the world once said, a lukewarm economy is the best thing for markets, because central banks will inject liquidity to bring it back to life. A booming, overheated economy is its worst enemy, because they’ll drain liquidity from the system, and you can say goodbye to the markets for a while.
That’s the backdrop as we reach the end of 2026, with a huge problem in oil. Strained shipping routes and supply chains, and attacks on the world’s biggest oil exporters.
And the market has already started pricing it in.
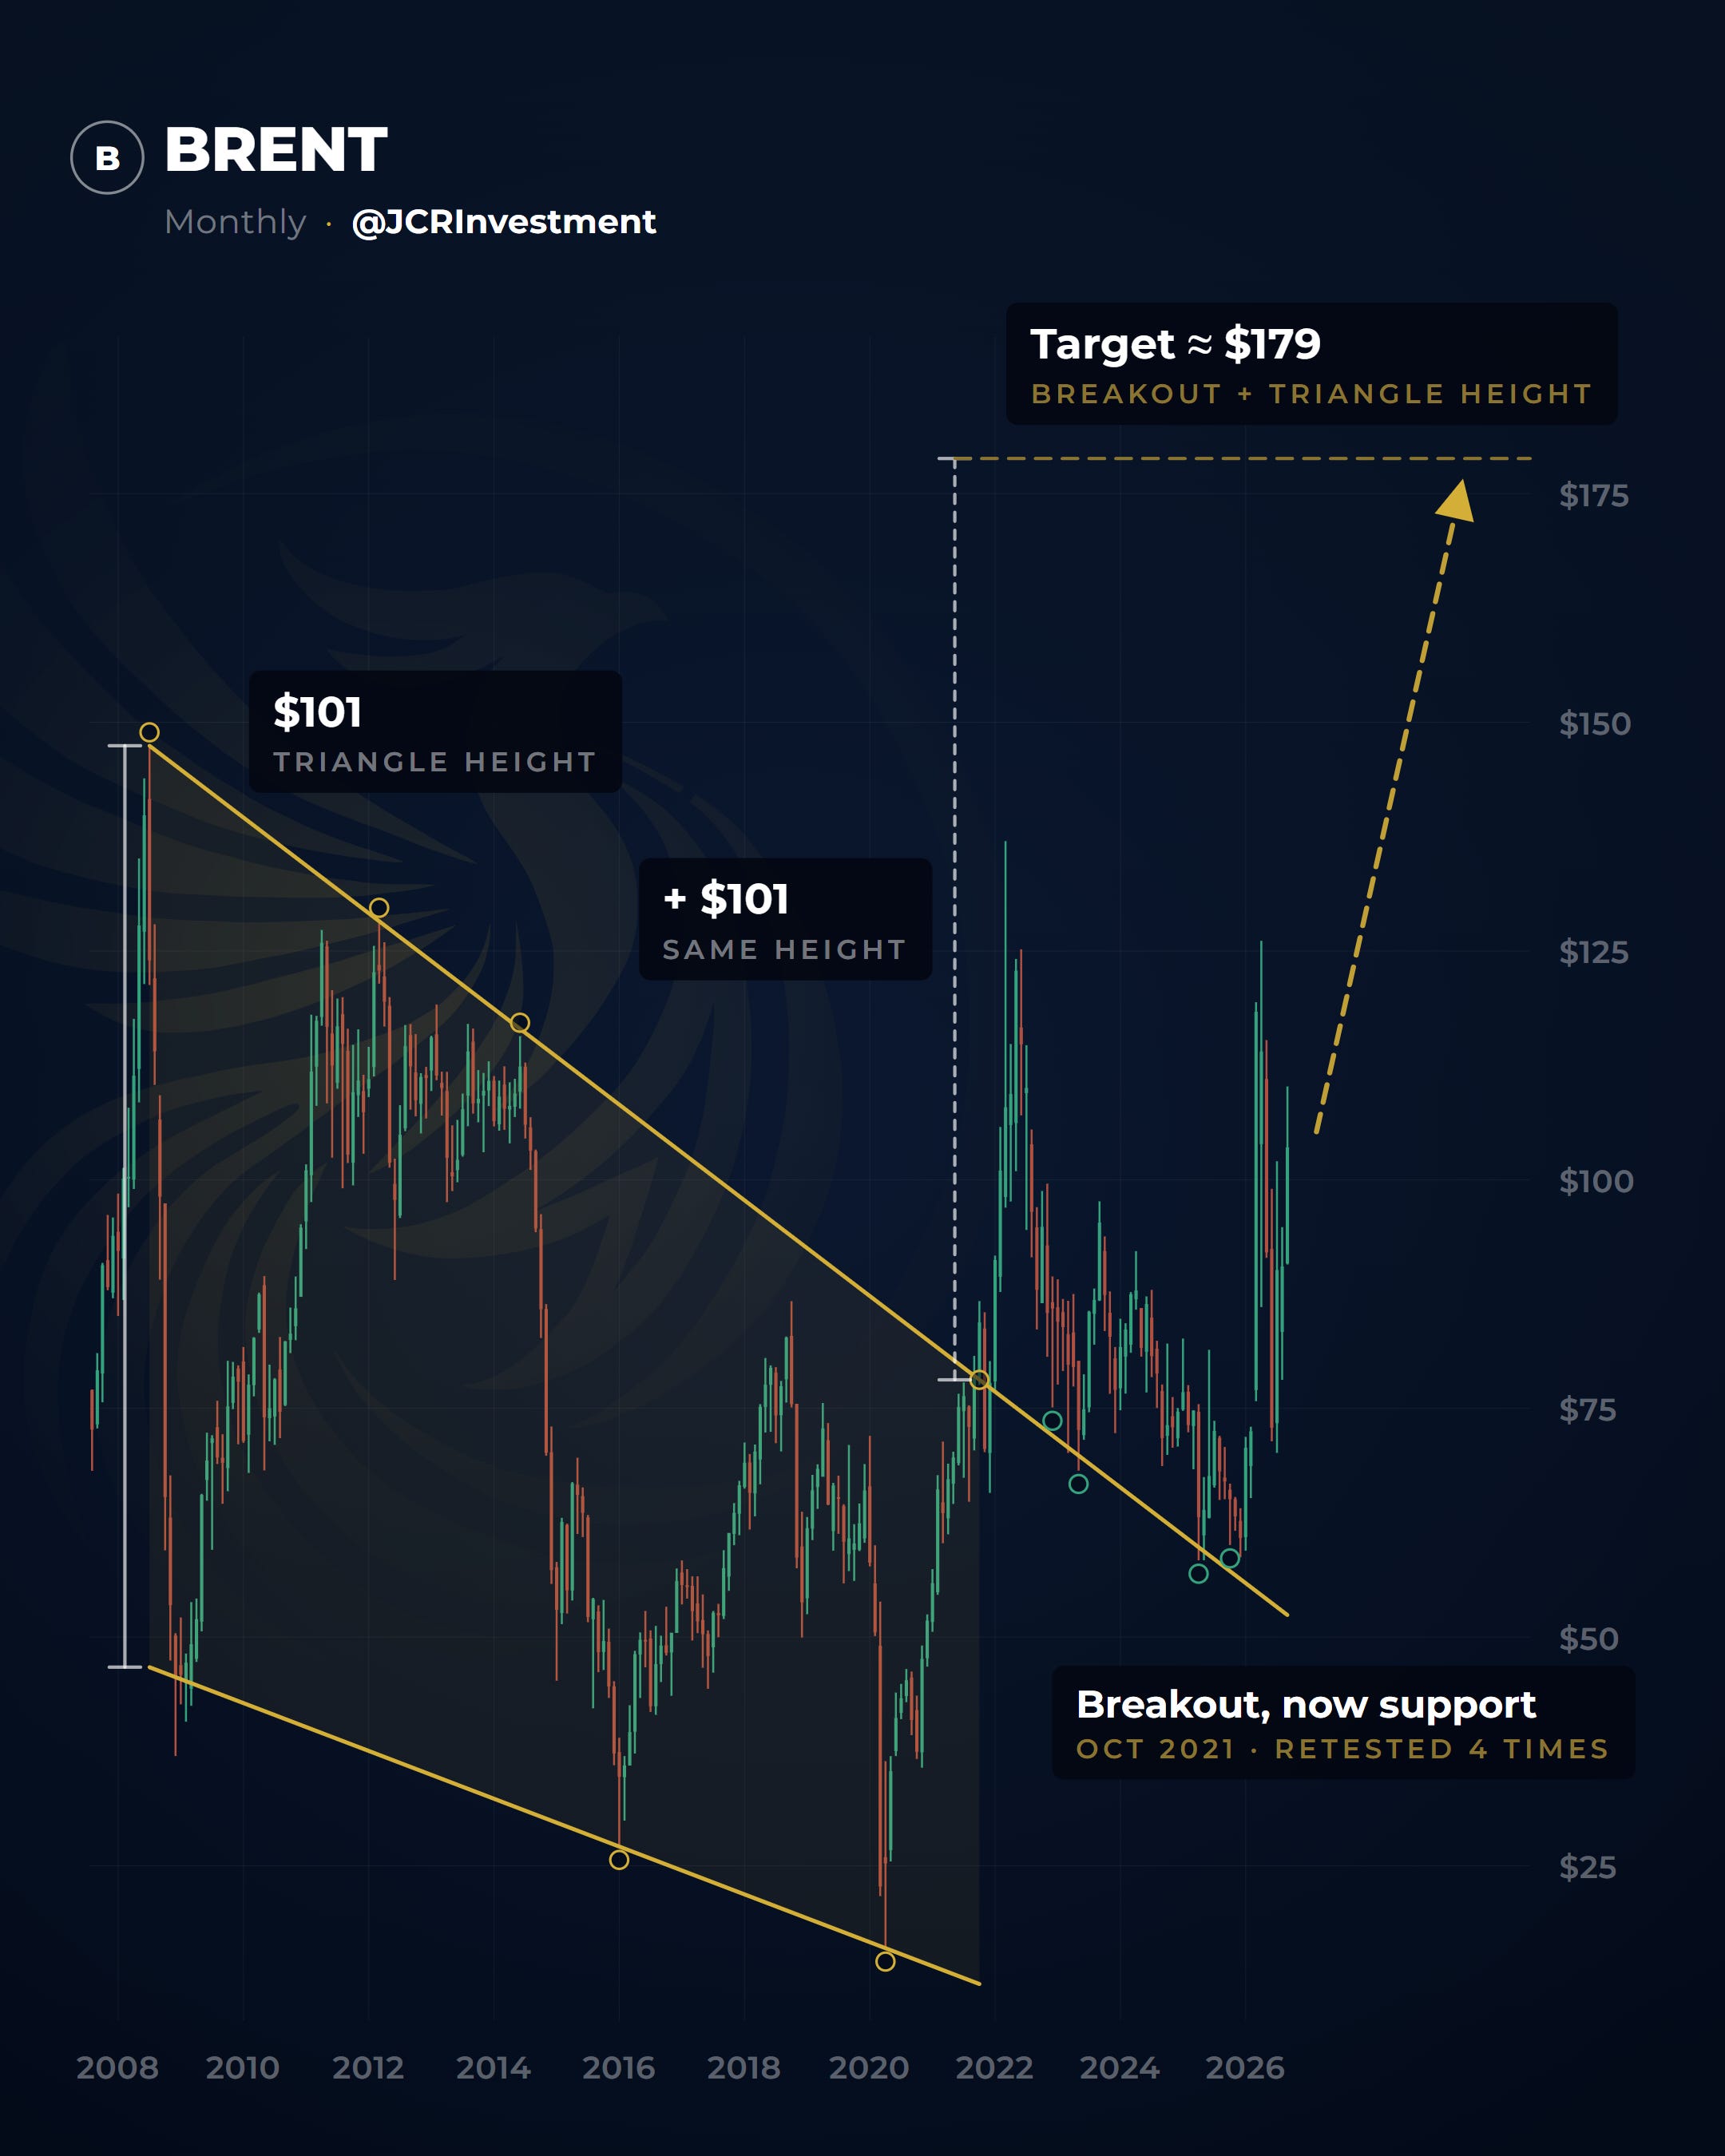
Oil is the heart of the economy, because a rise passes straight through to inflation. If this plays out, we’d see real problems, not just in the markets, but in everyone’s pocket and in the global economy.
Another key asset in the world is the dollar, the global reserve currency. Put simply, when it rises, that’s good for US stocks in the long run, because it pulls in capital from around the world, and it’s bad for emerging markets. When it falls, those flows leave the US for emerging markets.
That’s because these countries’ debt is denominated in dollars. When the dollar rises, that debt gets harder to pay, and capital flees those countries for the US.
For markets, a rising dollar puts downward pressure on stocks in the short term, and it’s also a safe haven. When people see trouble in the markets, they sell and hide in dollar bonds, which sends the dollar soaring.
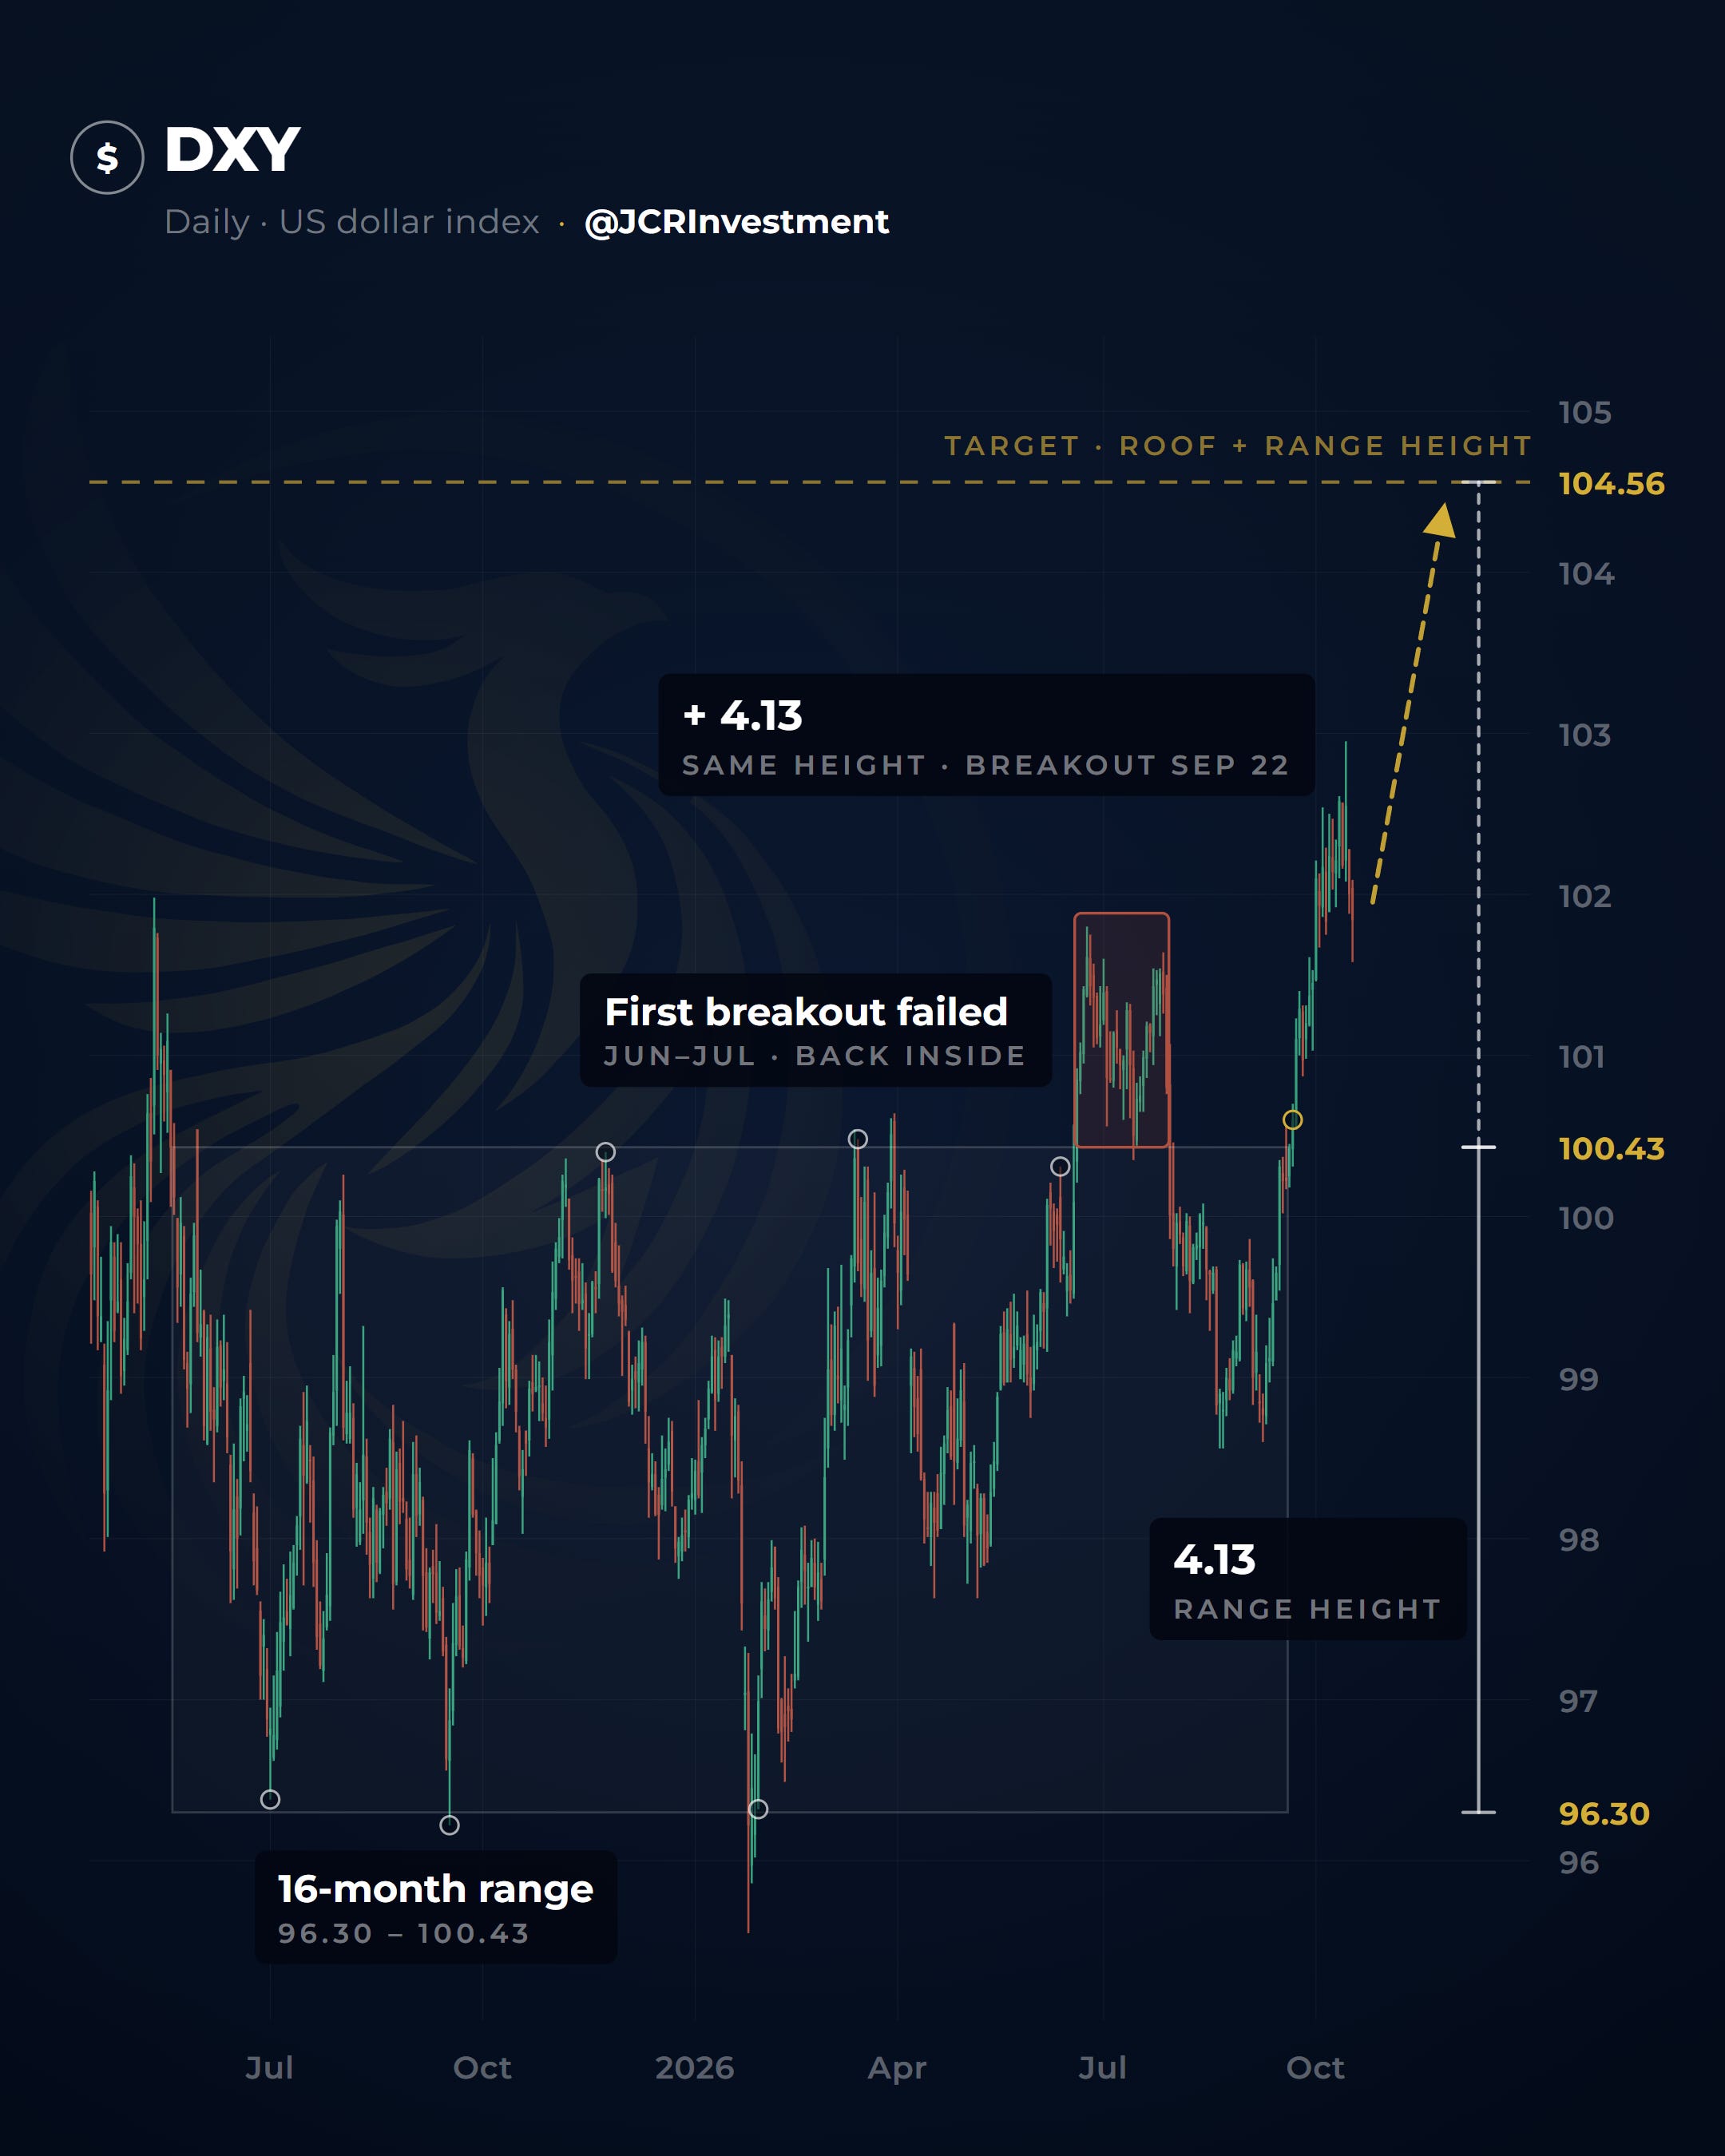
As you can see, the market is once again pricing in trouble, and it’s already showing in the dollar. Unlike everything else we’ve looked at, it has a bullish trend and an upside target in play.
Finally, let’s look at bonds. I know many of you aren’t familiar with them, but they’re literally the scaffolding that holds up the entire economy. Rising yields can bankrupt a country in less than a year, as we’ve seen before. That’s why bonds are truly the most important piece of the economy.
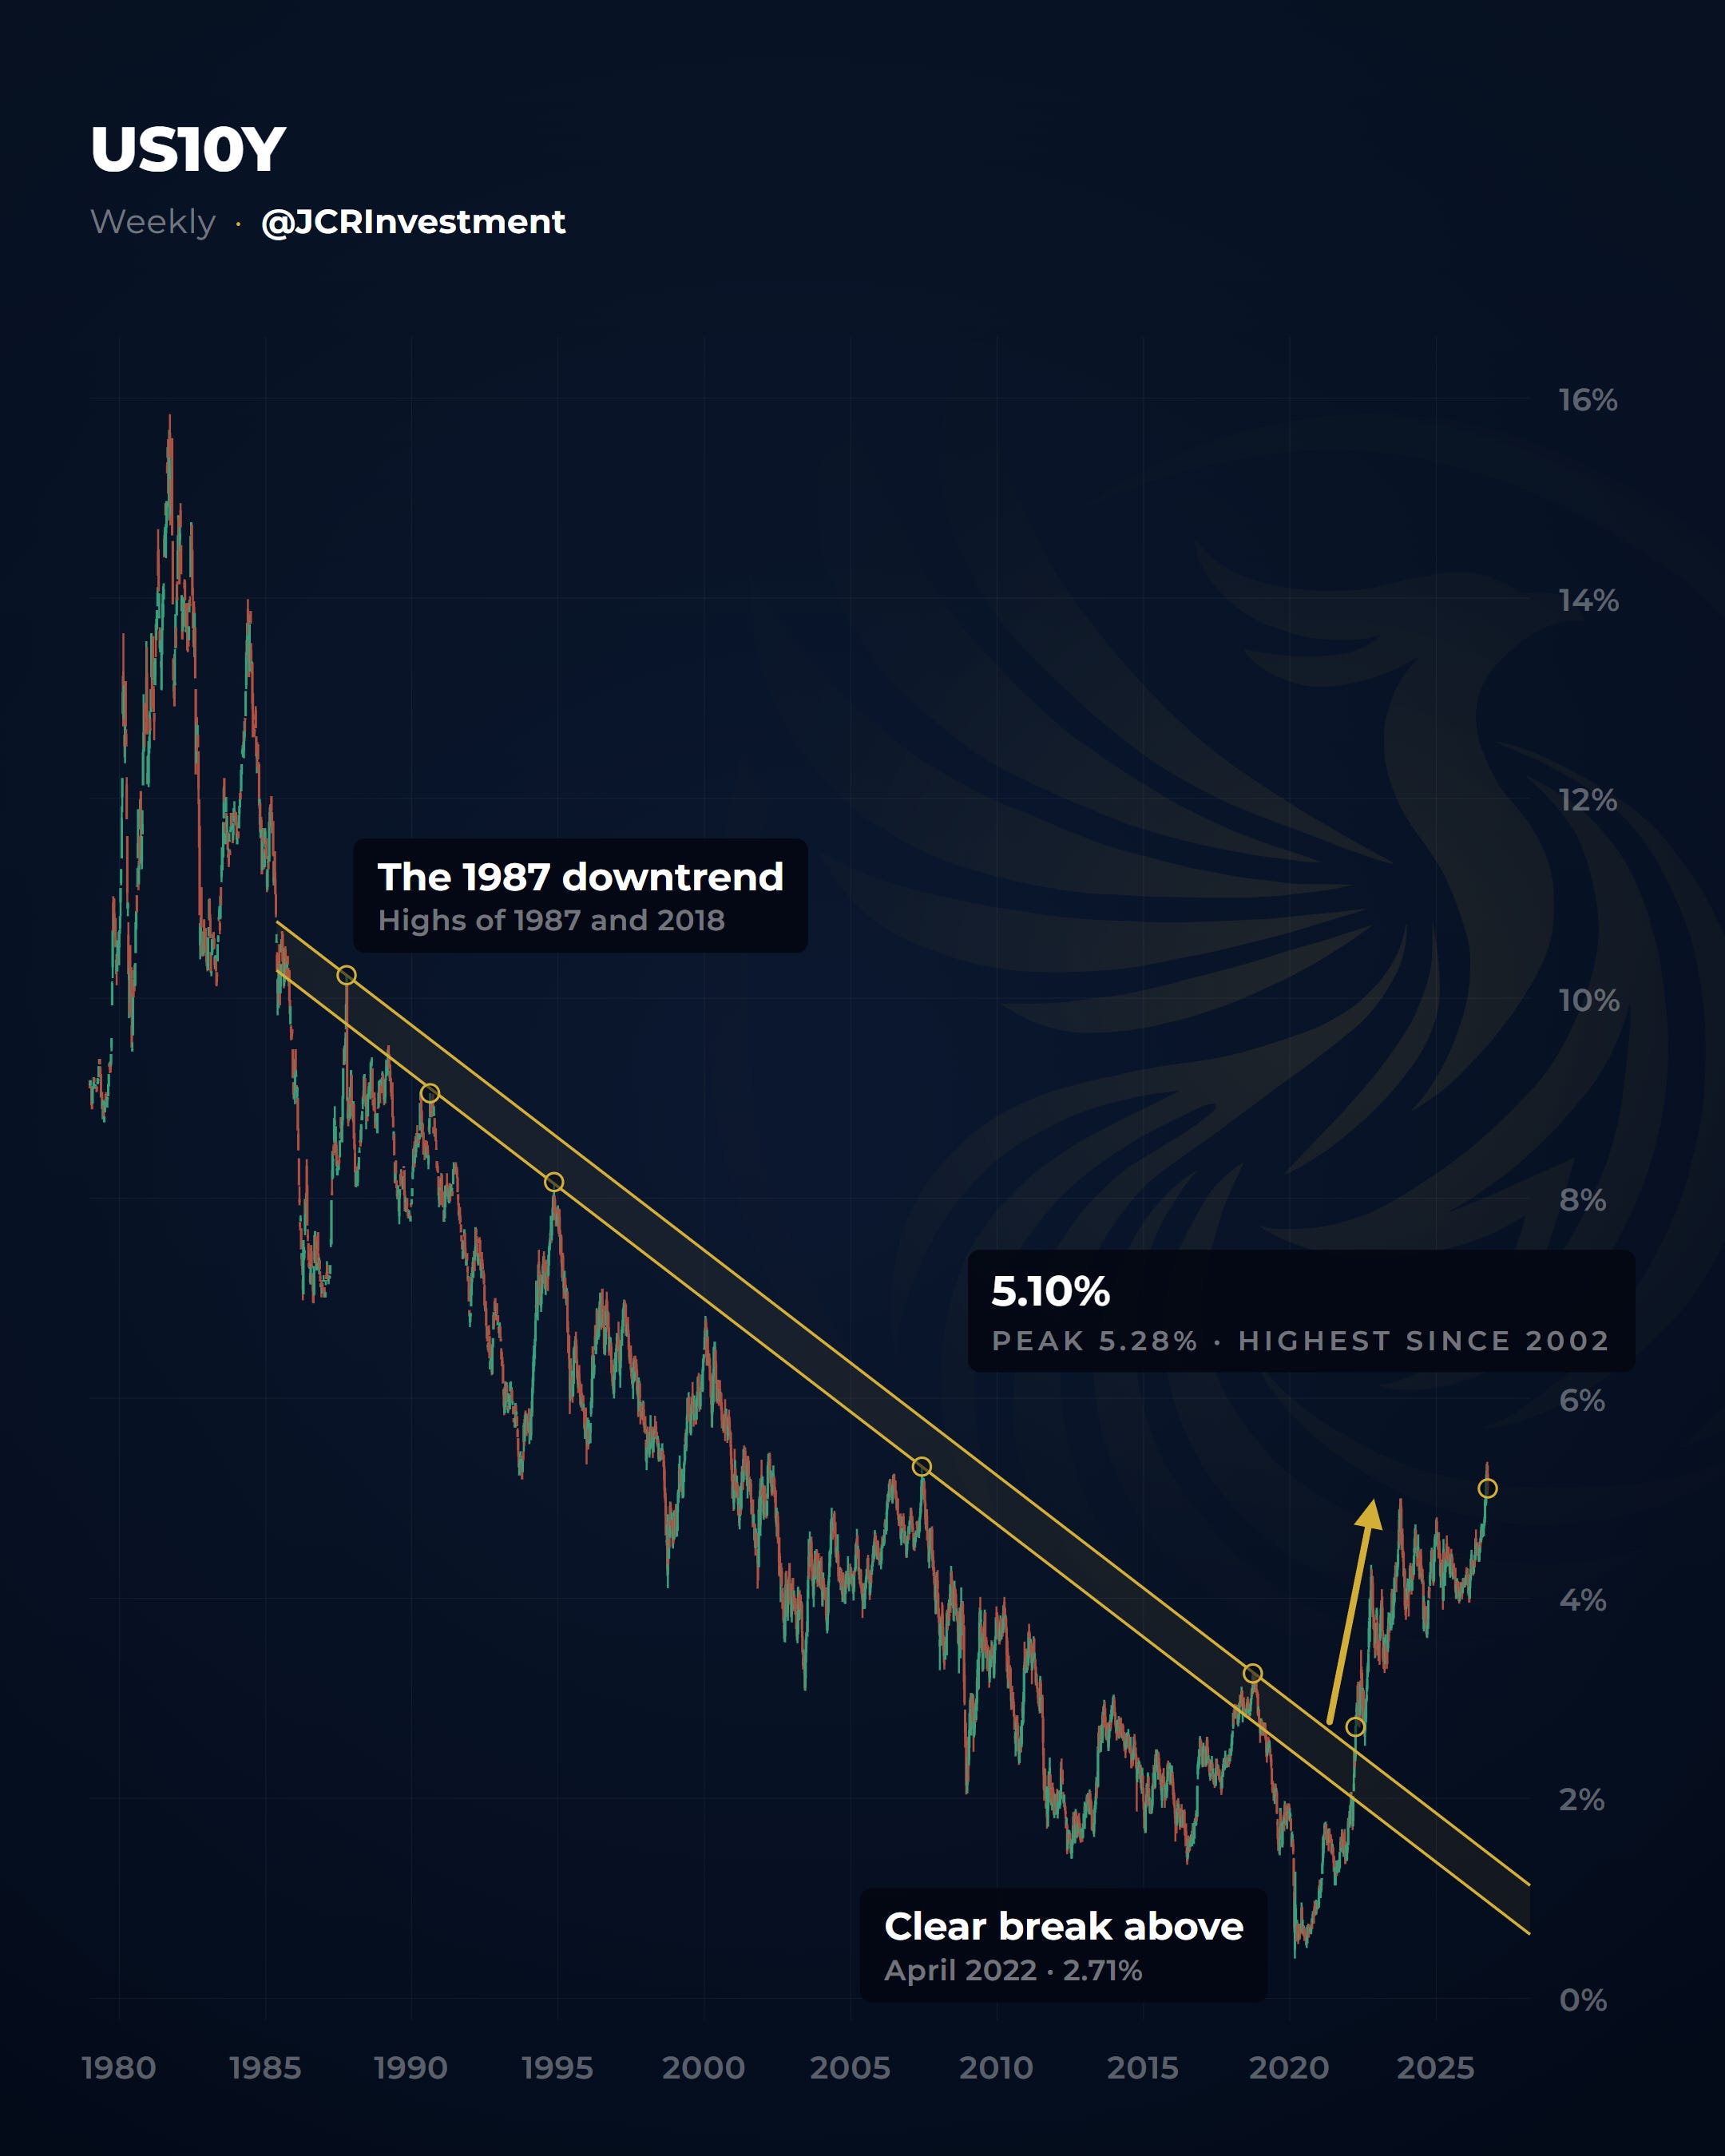
Here we can see how cheap money died in 2022. That’s what caused the correction back then. Today, yields keep climbing and are starting to put too much pressure on governments and companies. Every AI company is building its data centers with bond financing, and interest costs keep going up.
What is the market pricing in?
As you’ve seen, it’s pricing in a chain that’s older than you and me. Expensive oil drives up inflation, which pushes bond yields higher, which makes the Fed raise rates to kill that inflation, which leads to a stronger dollar.
Caught in the middle of all that, stocks are being hit on four fronts at once. Inflation, the dollar, oil and bonds.
Stocks have already started pricing in this scenario, and from individual names to the indices, they’re showing correction signals. A single asset can fool you. A whole series of assets moving in their classic chain can’t.
These signals will keep developing over the coming weeks. We may see bounces, drops and explosive moves either way, but for now the trend is clear.
The market is pricing in a correction.
My portfolio
In my previous job as a helicopter certifier, I learned that my actions have to back up my words. Think about it. Would you get on a helicopter with your family if the person responsible for it refused to get on because they didn’t trust it? I’m guessing you wouldn’t put your family on it in a million years, and you’d have a few not so nice words for that person.
What I mean is that I learned to prove things and to be the first to trust my own work. That’s why my money is where my mouth is.
I have $40,000 in cash in a public portfolio that I’m sharing here with you.
The plan for this portfolio is clear. Wait for the correction to play out over the coming weeks, then get into the sectors and assets with the brightest future ahead. I’ll share those assets and my entry points here, and I’ll let you know the day I buy.
But how do you know it won’t be a crash like 2000 or 2008?
Well, first of all, the moment the correction hits, every media outlet will say it’s the end of the economy and the stock market. Like always.
Among many other things, this is the main reason I believe that after a correction, 2027 and 2028 could be fantastic years.
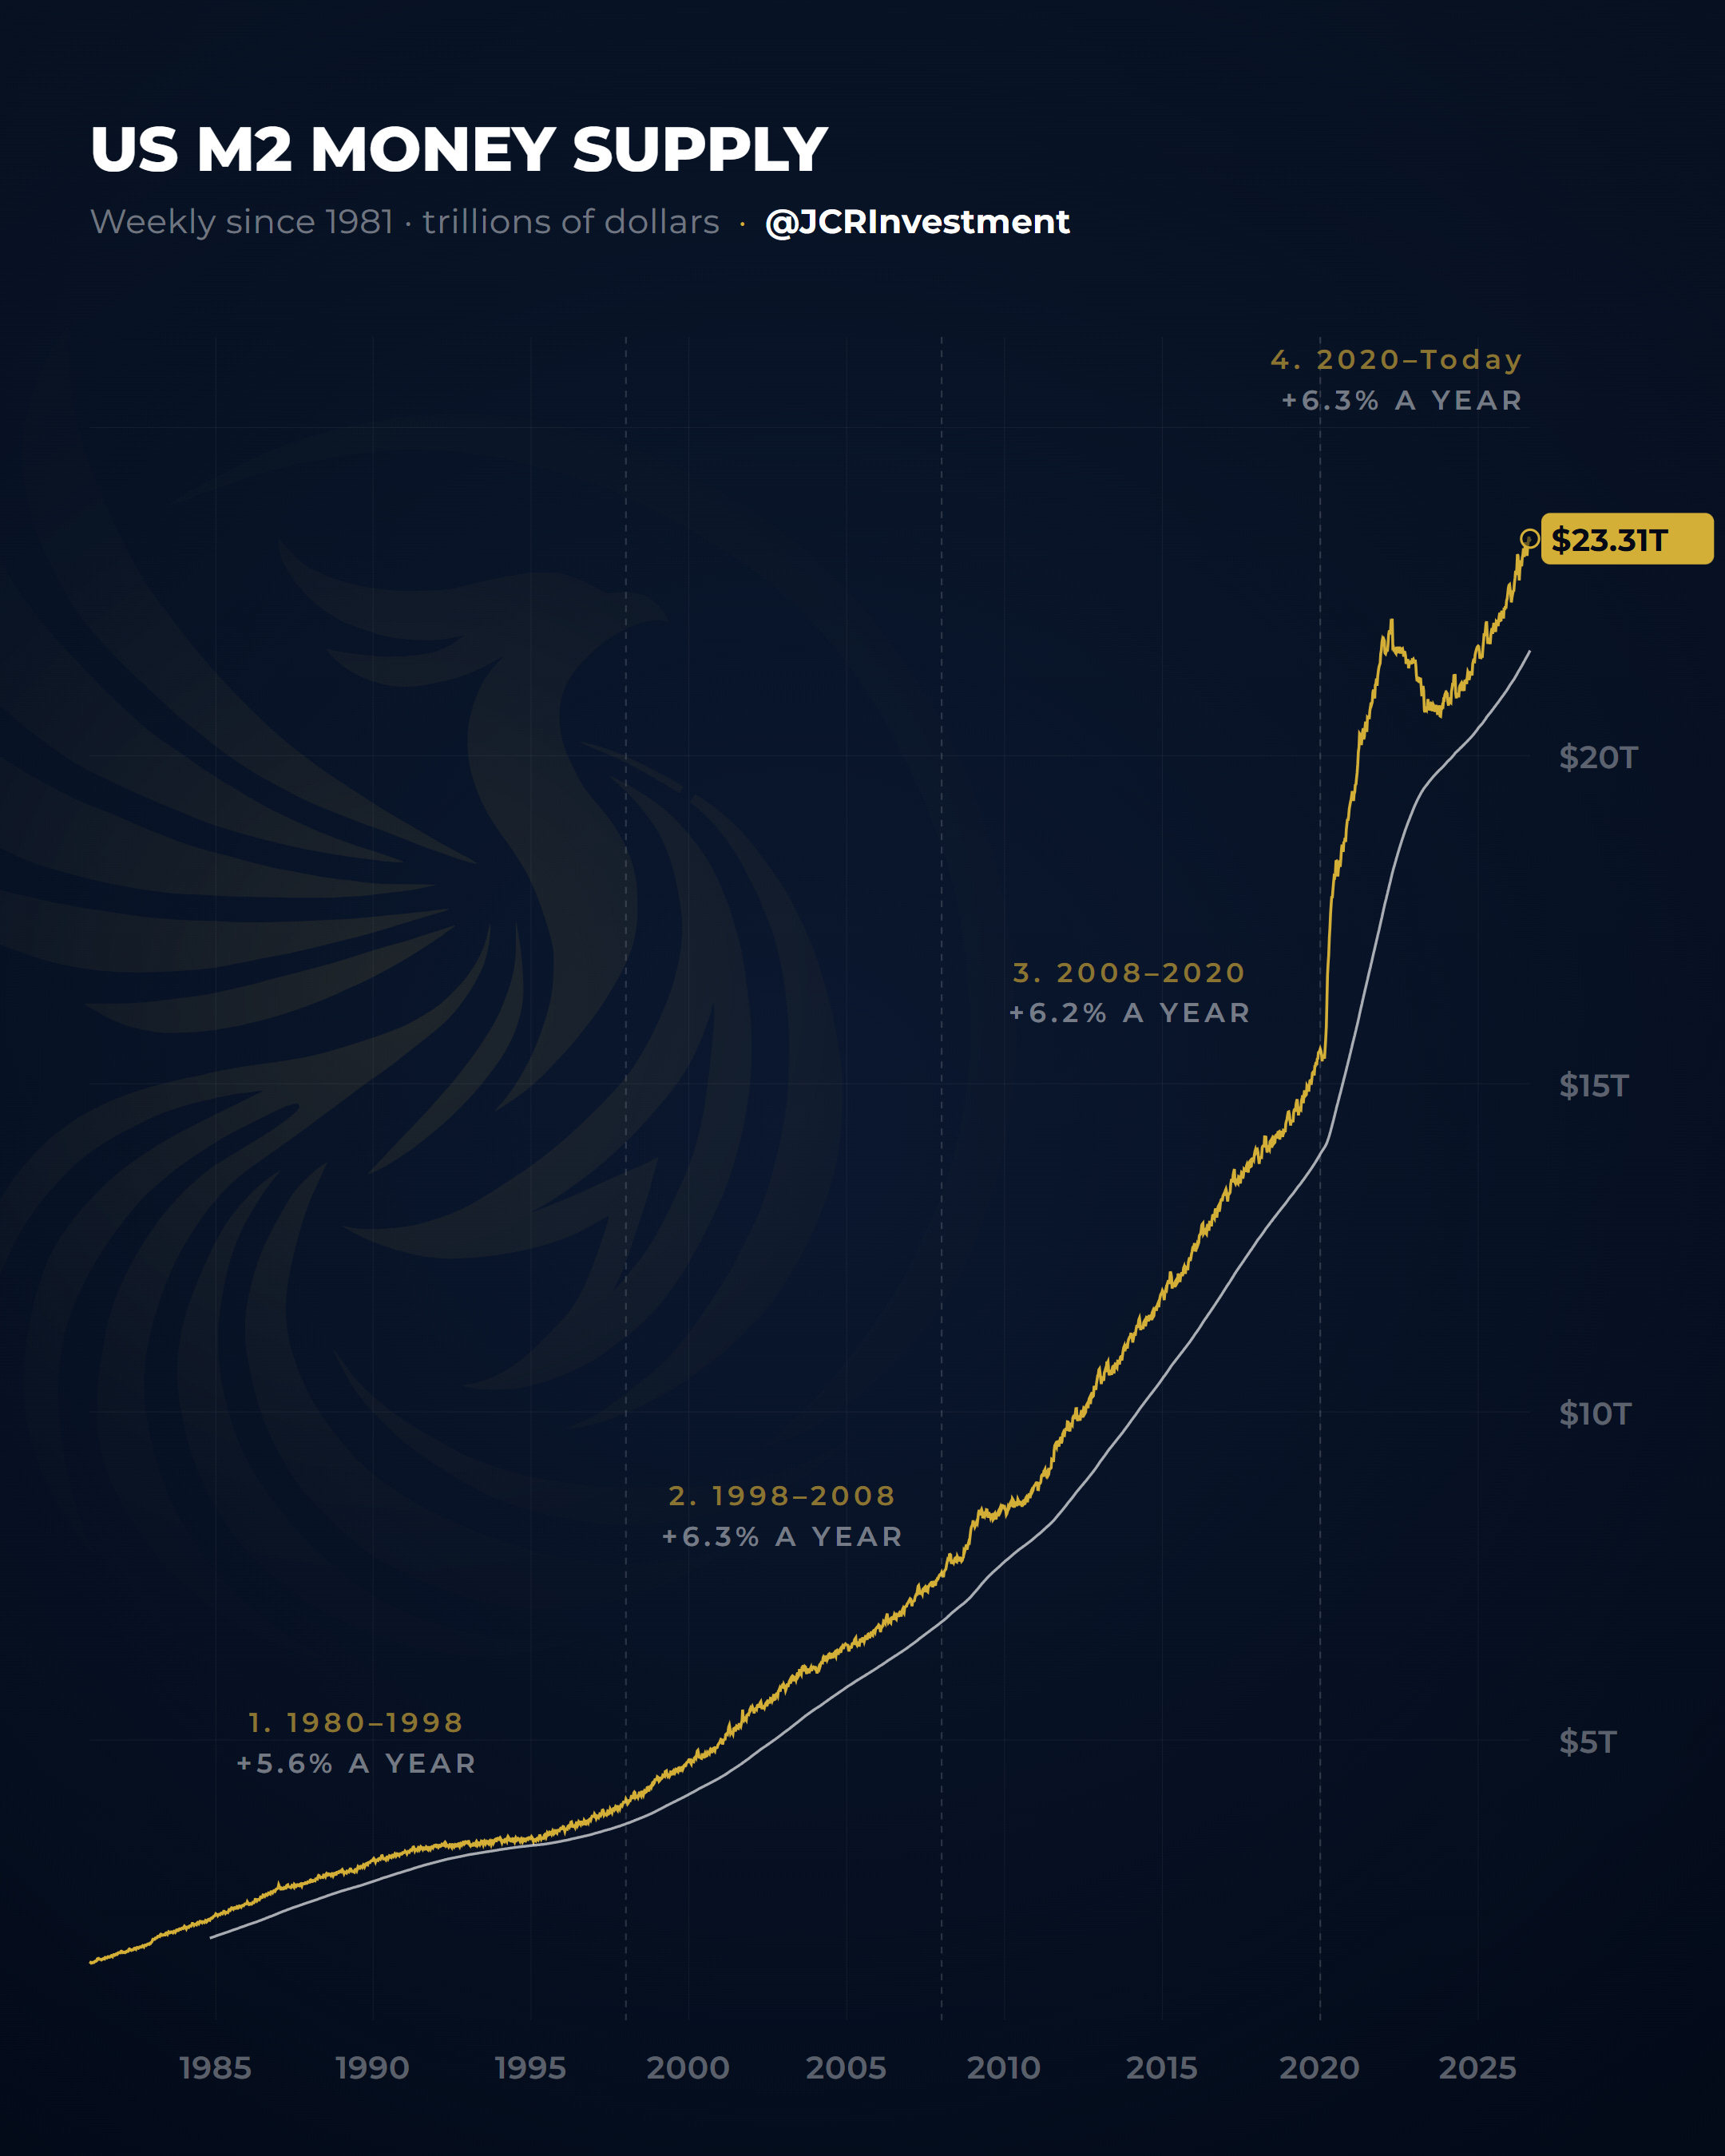
Earlier I talked about inflation and the 2021 correction. That inflation wasn’t caused by wars or supply chains. They helped, sure, but the main reason was this.
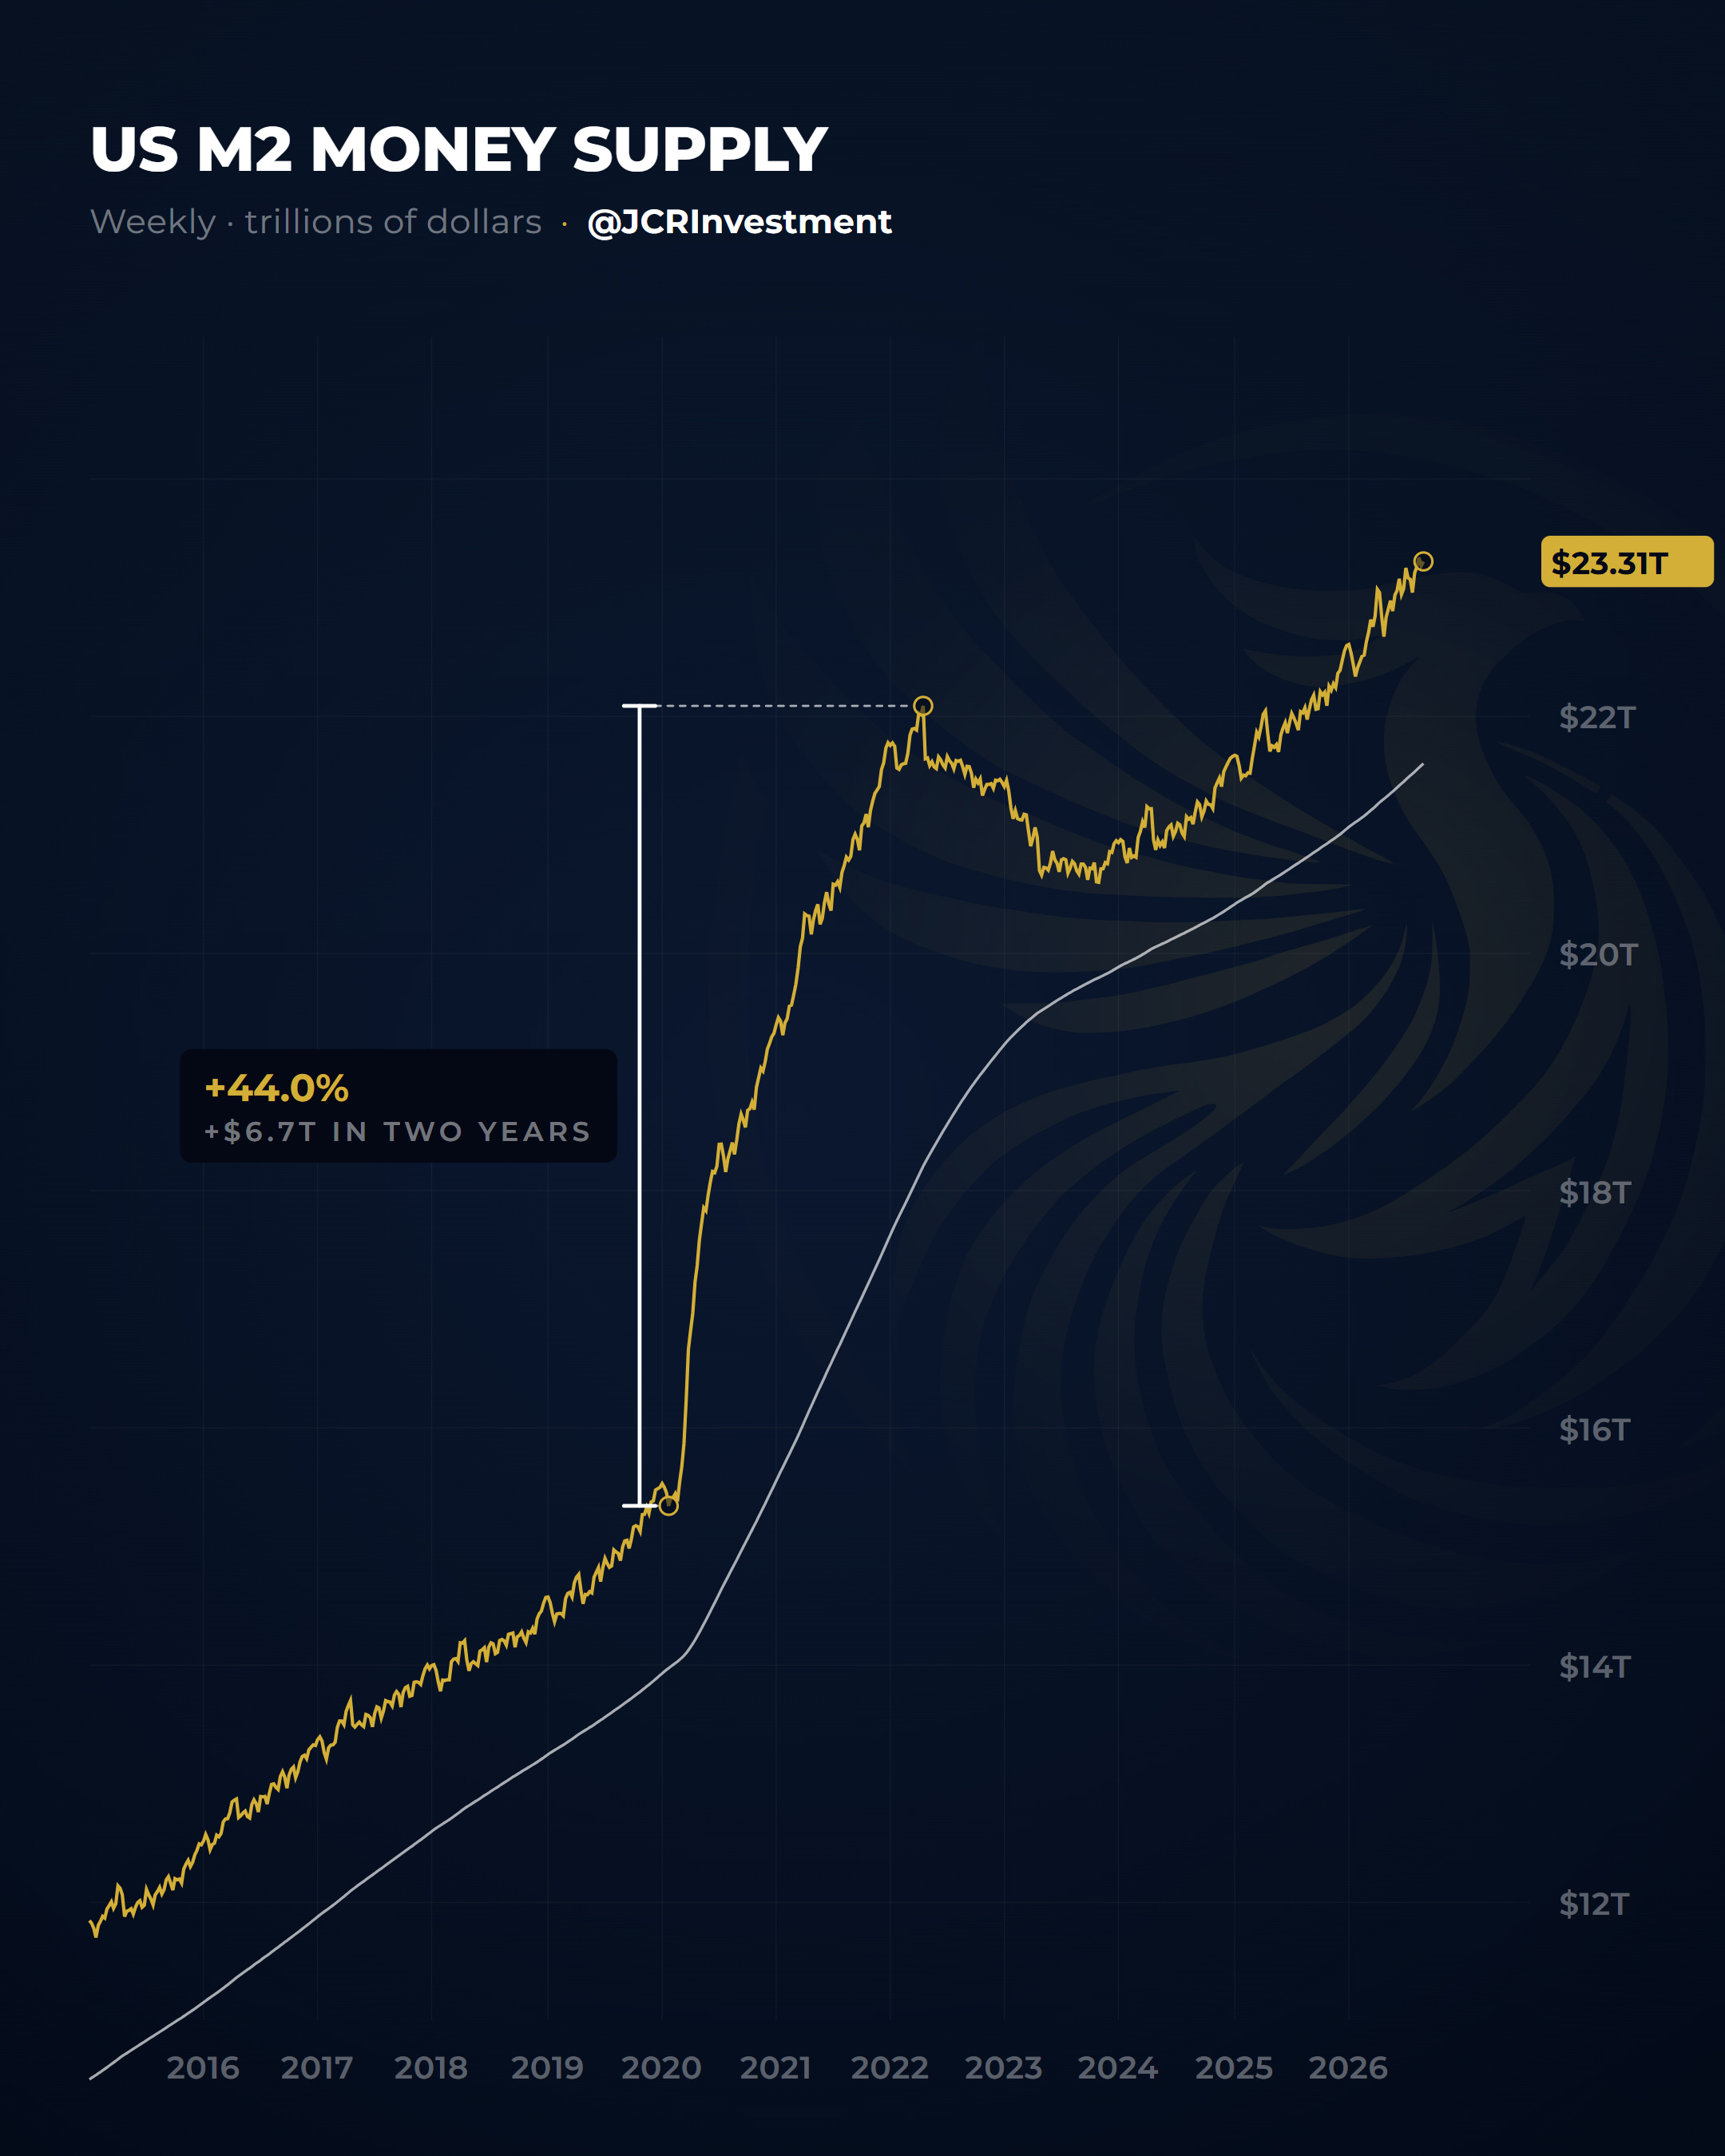
The money supply grew 44% in just two years after Covid. Obviously, if you suddenly print almost half the money in circulation in two years, inflation and prices go through the roof.
We’re talking about $21.7 trillion printed since 1981, and $6.7 trillion of it in just two years. The total today is $23.3 trillion.
M2 isn’t just cash and it isn’t global liquidity. It counts all the spendable dollars in the US, cash plus bank deposits. That’s why it’s one of the best gauges of how much money central banks and governments are really pumping into the economy.
The cycle that never stops
So why will it be a correction? Because they’re not going to stop printing money. That will devalue the currency and cause major inflation, which will keep pushing markets higher.
And yes, along the way they can fall as much as they want, but they’ll recover. And without a doubt, the biggest risk for you right now is leaving your money in the bank.
Every day I share all the research and updates on everything I’ve learned over 11 years, the knowledge that has allowed me to make investing, which has always been my passion, my full time work.
Every week we’ll follow how the markets move and how this whole trend plays out. Follow me so you don’t miss a thing.
These articles take me a lot of time to analyze and research. I hope this one helped you see the market much more clearly and filter out the noise and narratives that always surround it. As a great investor once said,
“The market is the perfect machine for discounting what’s happening.”
That’s why I focus on understanding it, and that’s what I’ll share with you every day, to help you understand it too.
Cheers, investor.
J.C. Rodriguez