

Today I’m opening a public portfolio with $40,000 of my own money, in a real account anyone can follow, and from here on every move, every date and every reason gets written down before anybody knows whether it worked.
All of it is in cash, still, waiting. And I know that, to a lot of people, sounds strange. You open a portfolio to invest, not to watch.
But investing well is, above all, knowing when not to.
Let me show you the whole map. Data, no hype, and every chart I look at myself.
By the end, you will understand why this portfolio first waits for an entry window between September and December 2026, and how you can prepare, protect your portfolio, and take advantage of that window to build wealth that keeps growing even as the world changes.
Is the market sick, or just one corner of it?
Just one corner. And this is the first thing to understand, because almost everyone gets it wrong. For months you’ve been hearing that “there’s an AI bubble” and that “this is going to blow up”.
But when you get down to the data, the economy is far from broken: unemployment is at 4.2% and falling, not rising; the companies in the index earned 20% more than last year, with record margins; credit is as calm as it has been in years; and inflation is rolling back down fast, faster than almost anyone expected. None of that is an economy on the edge of the abyss.
The bubble, if you want to call it that, is in one single place: semiconductors.
Something has happened there that is worth looking at with respect, because we’ve seen it before.
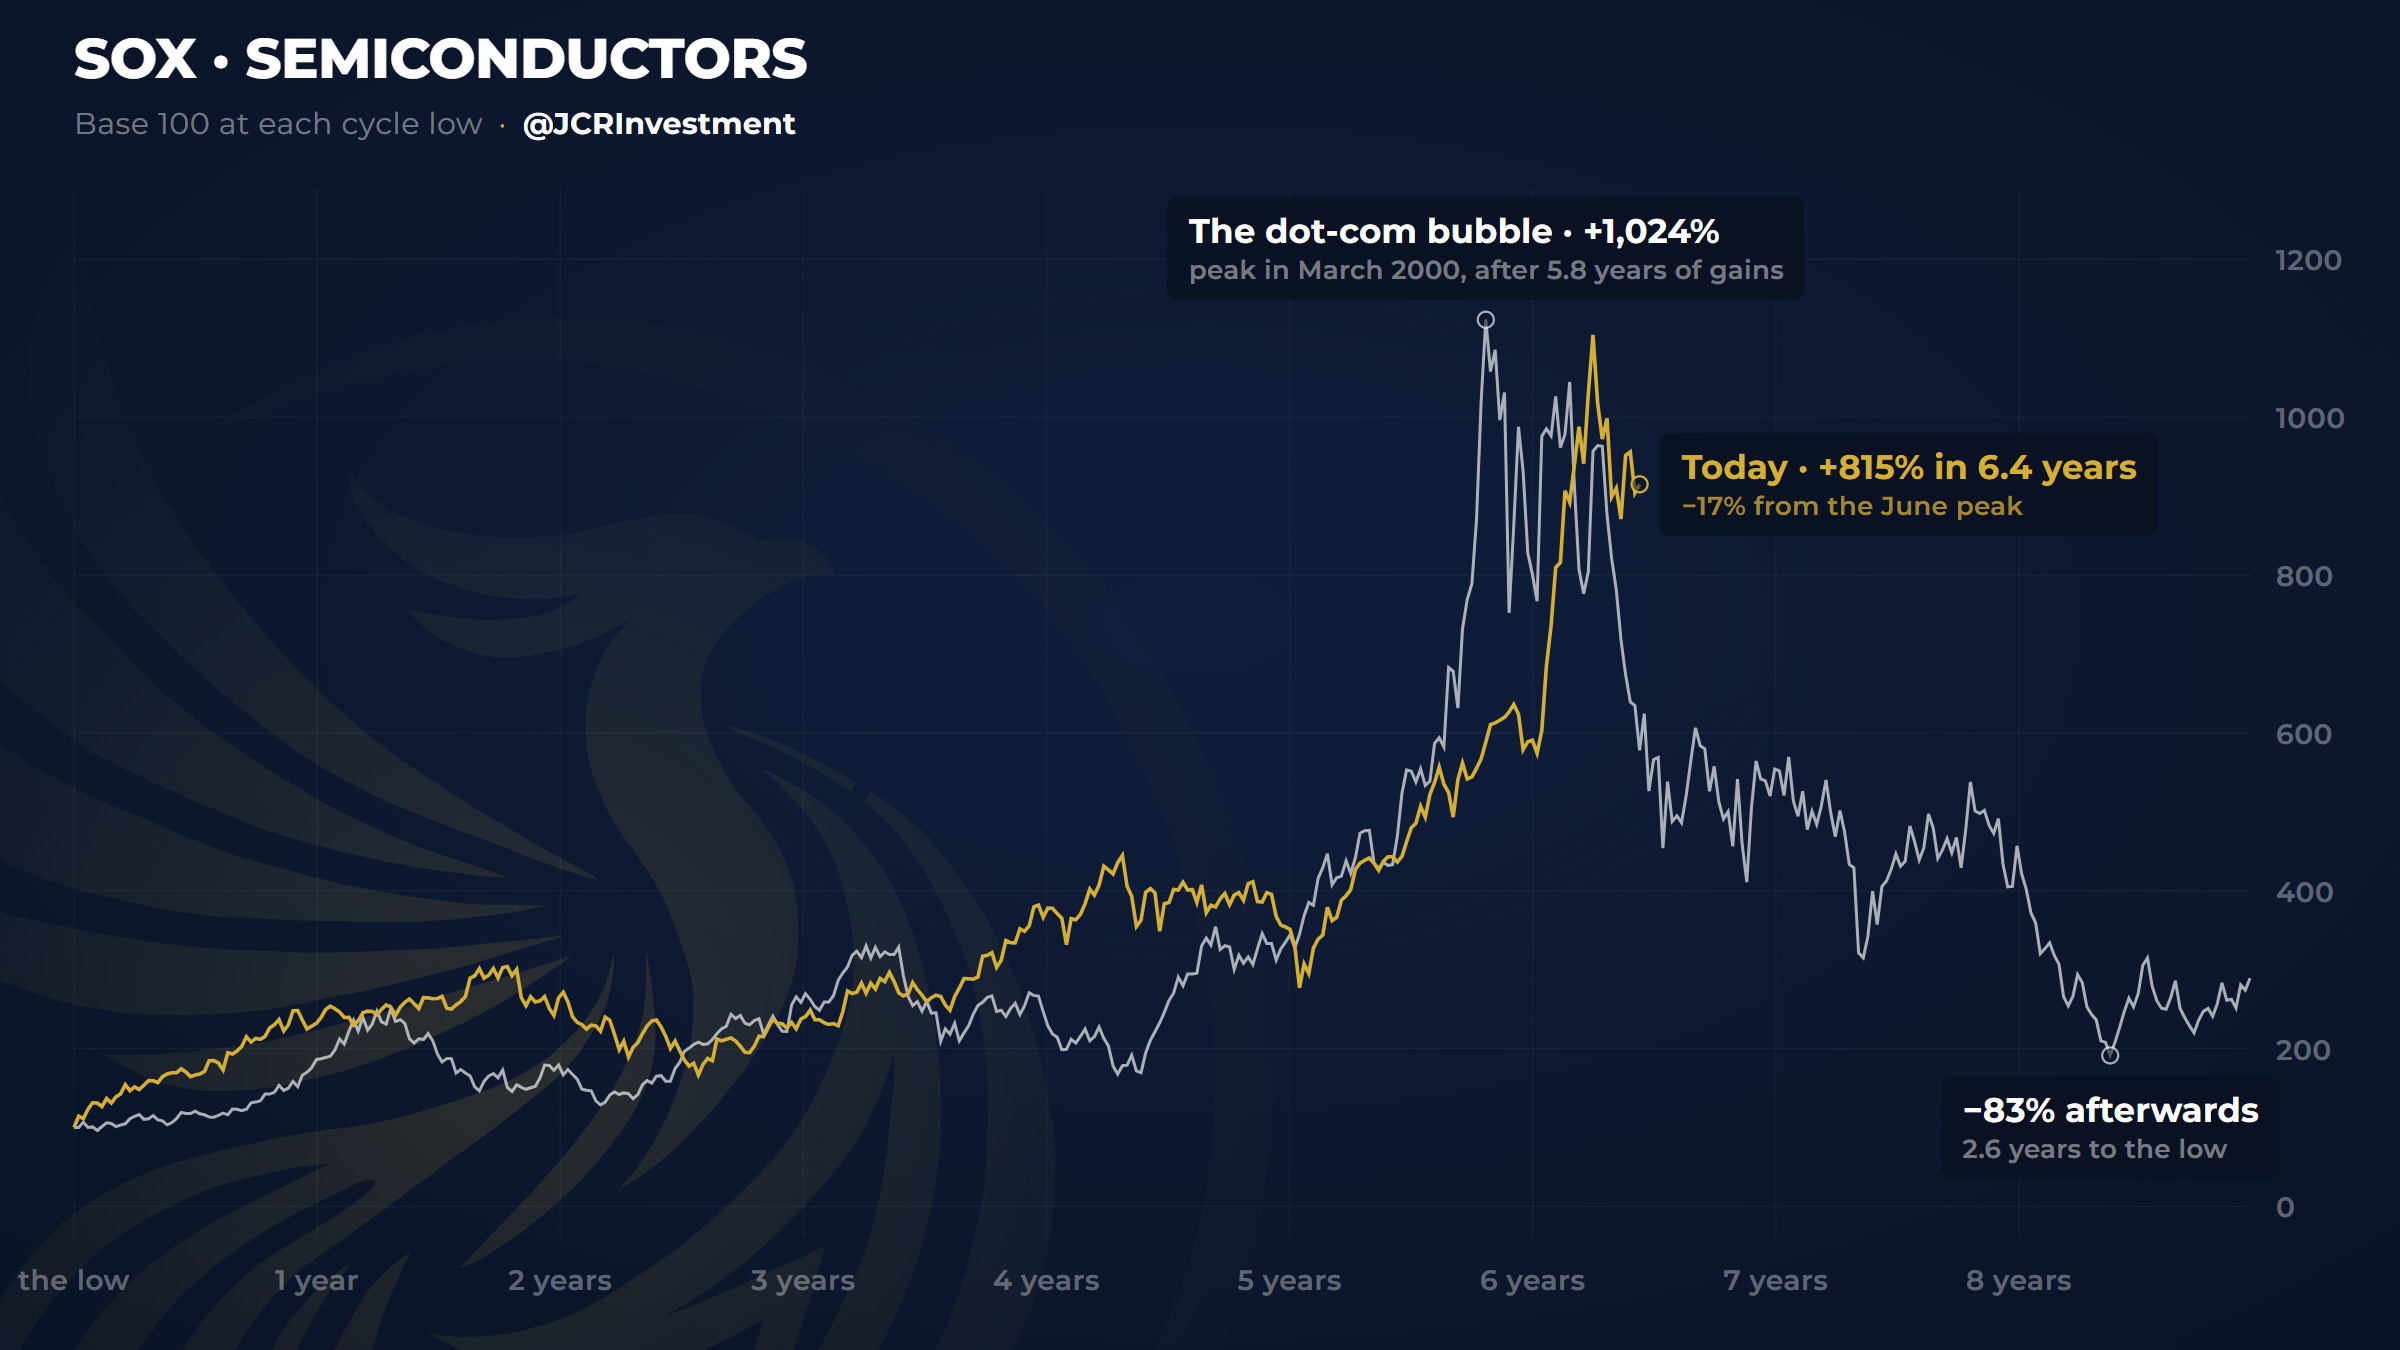
That chart costs me a bit of sleep, I won’t lie to you. It’s the same index, twenty-five years apart, walking a very similar path.
It does not mean it’s going to fall 83% again. Two cases don’t make a rule, and I’ll come back to this at the end, because it has a second, far more optimistic reading.
But it does mean this corner of the market has run a very long way, very fast, and those things rarely cool down gently.
I said two cases don’t make a rule. Here is a third, and this one is not from a history book: it happened this summer.
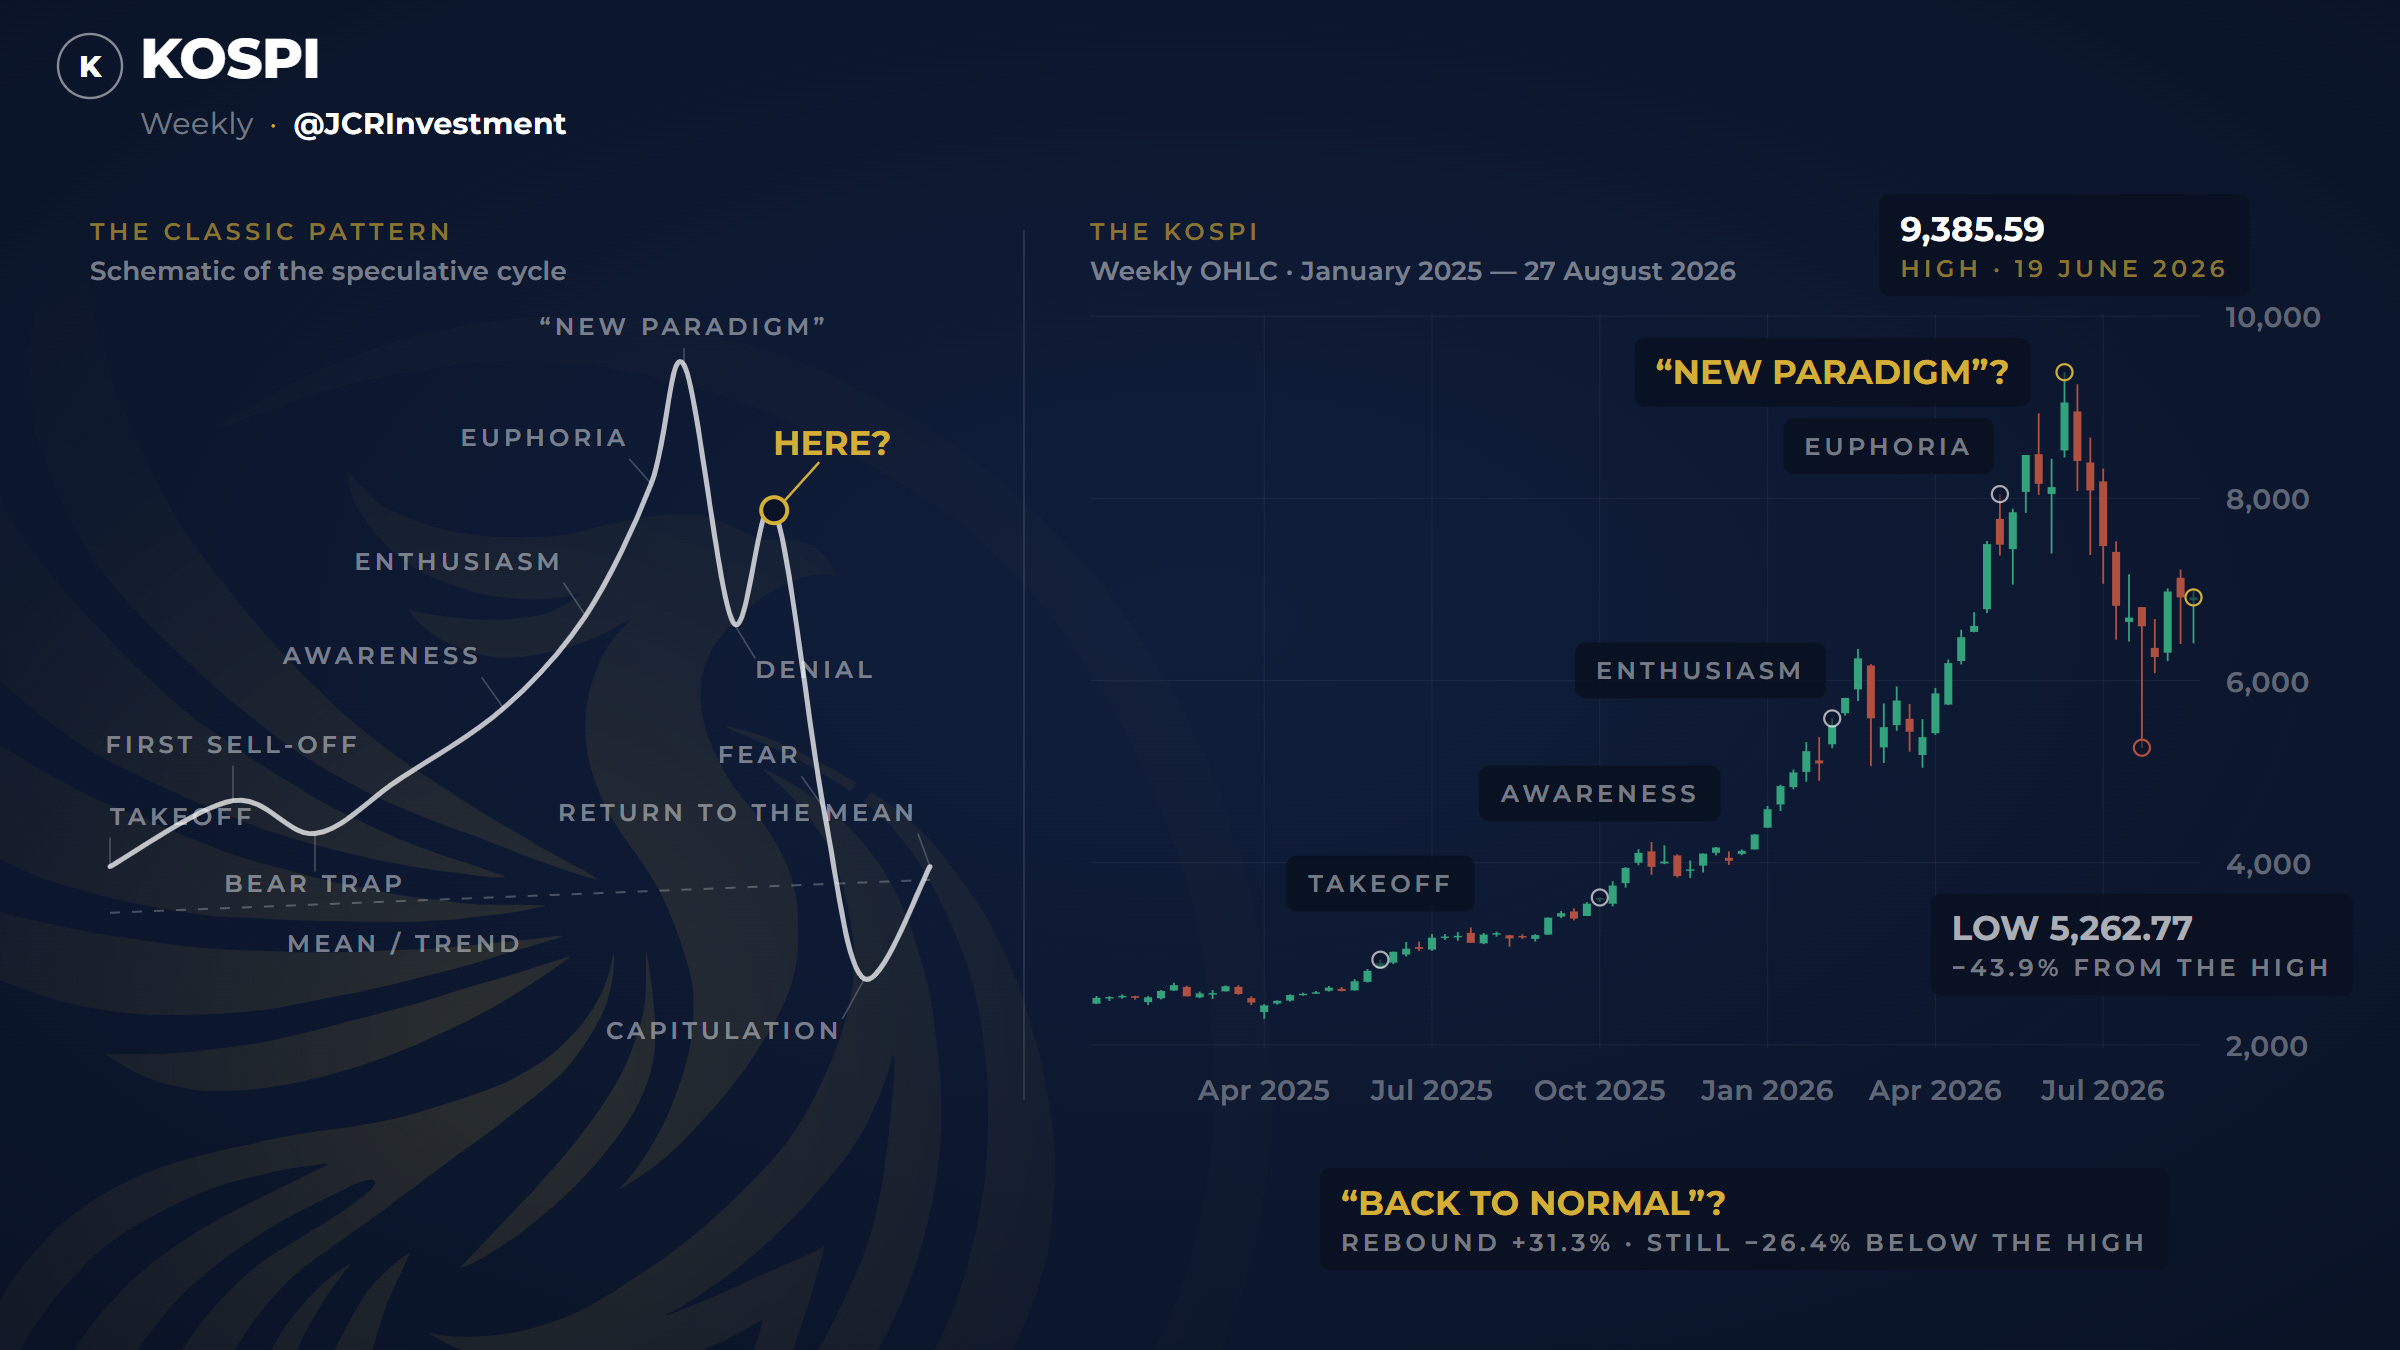
That is the KOSPI, the South Korean index. Its two biggest companies, Samsung and SK Hynix, make the memory chips the whole artificial intelligence build-out runs on, so when the chip trade moves, Korea moves first and moves hardest.
And look at what it did. It climbed the entire textbook —takeoff, enthusiasm, euphoria— and topped on 19 June, right at the point where everyone starts explaining why this time is different.
Six weeks later it was 43.9% lower.
Now it looks like it’s bouncing, and everyone says the worst is over. It still worries me a lot, because these moves are set up to leave people long and trapped, and then slam it violently lower.
And why does a single sector worry me?
A big problem is building in the semiconductor sector. A sector that has led indices as important as the Nasdaq 100. A sector that, as we can see, is already signalling that a serious correction is coming.
I firmly believe that if that correction arrives, it will drag the indices down with it, hard and fast.
So far the chips have corrected and the indices have barely noticed, because of something called sector rotation: the money leaves one part of the index and moves into another, so the index itself holds up.
When that rotation runs out and semiconductors keep falling, the index will feel it with full force.
And I’m not imagining it. There are already cracks. In the three big names in artificial intelligence, the price kept rising while the force pushing it was running out.
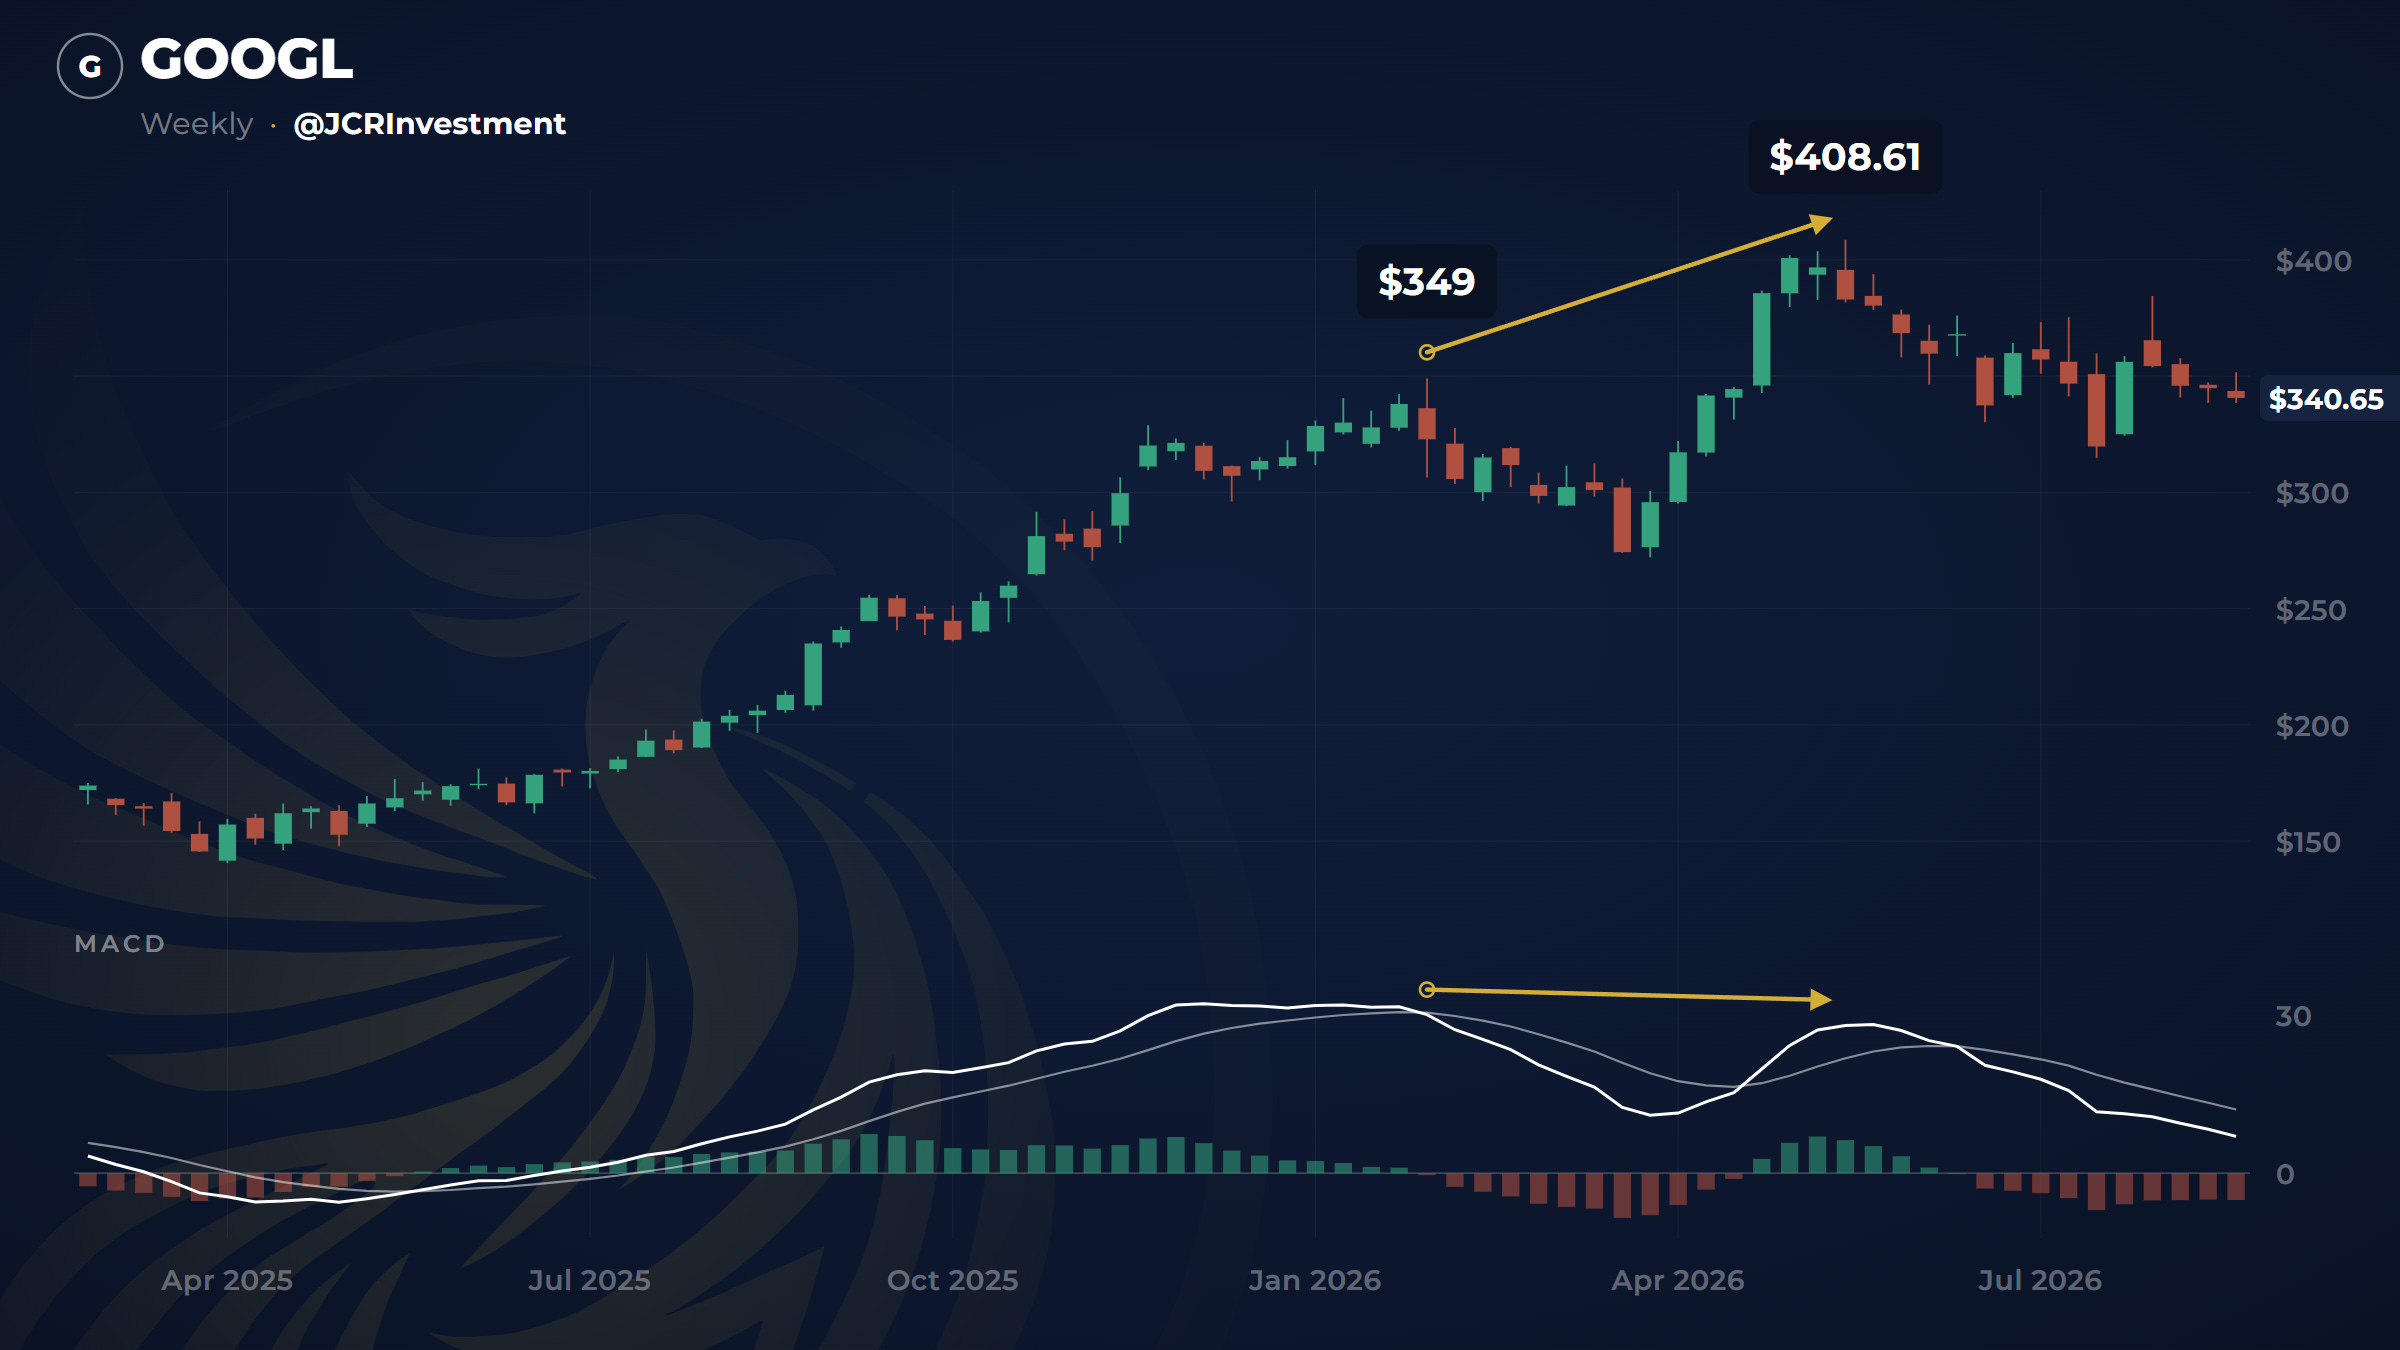
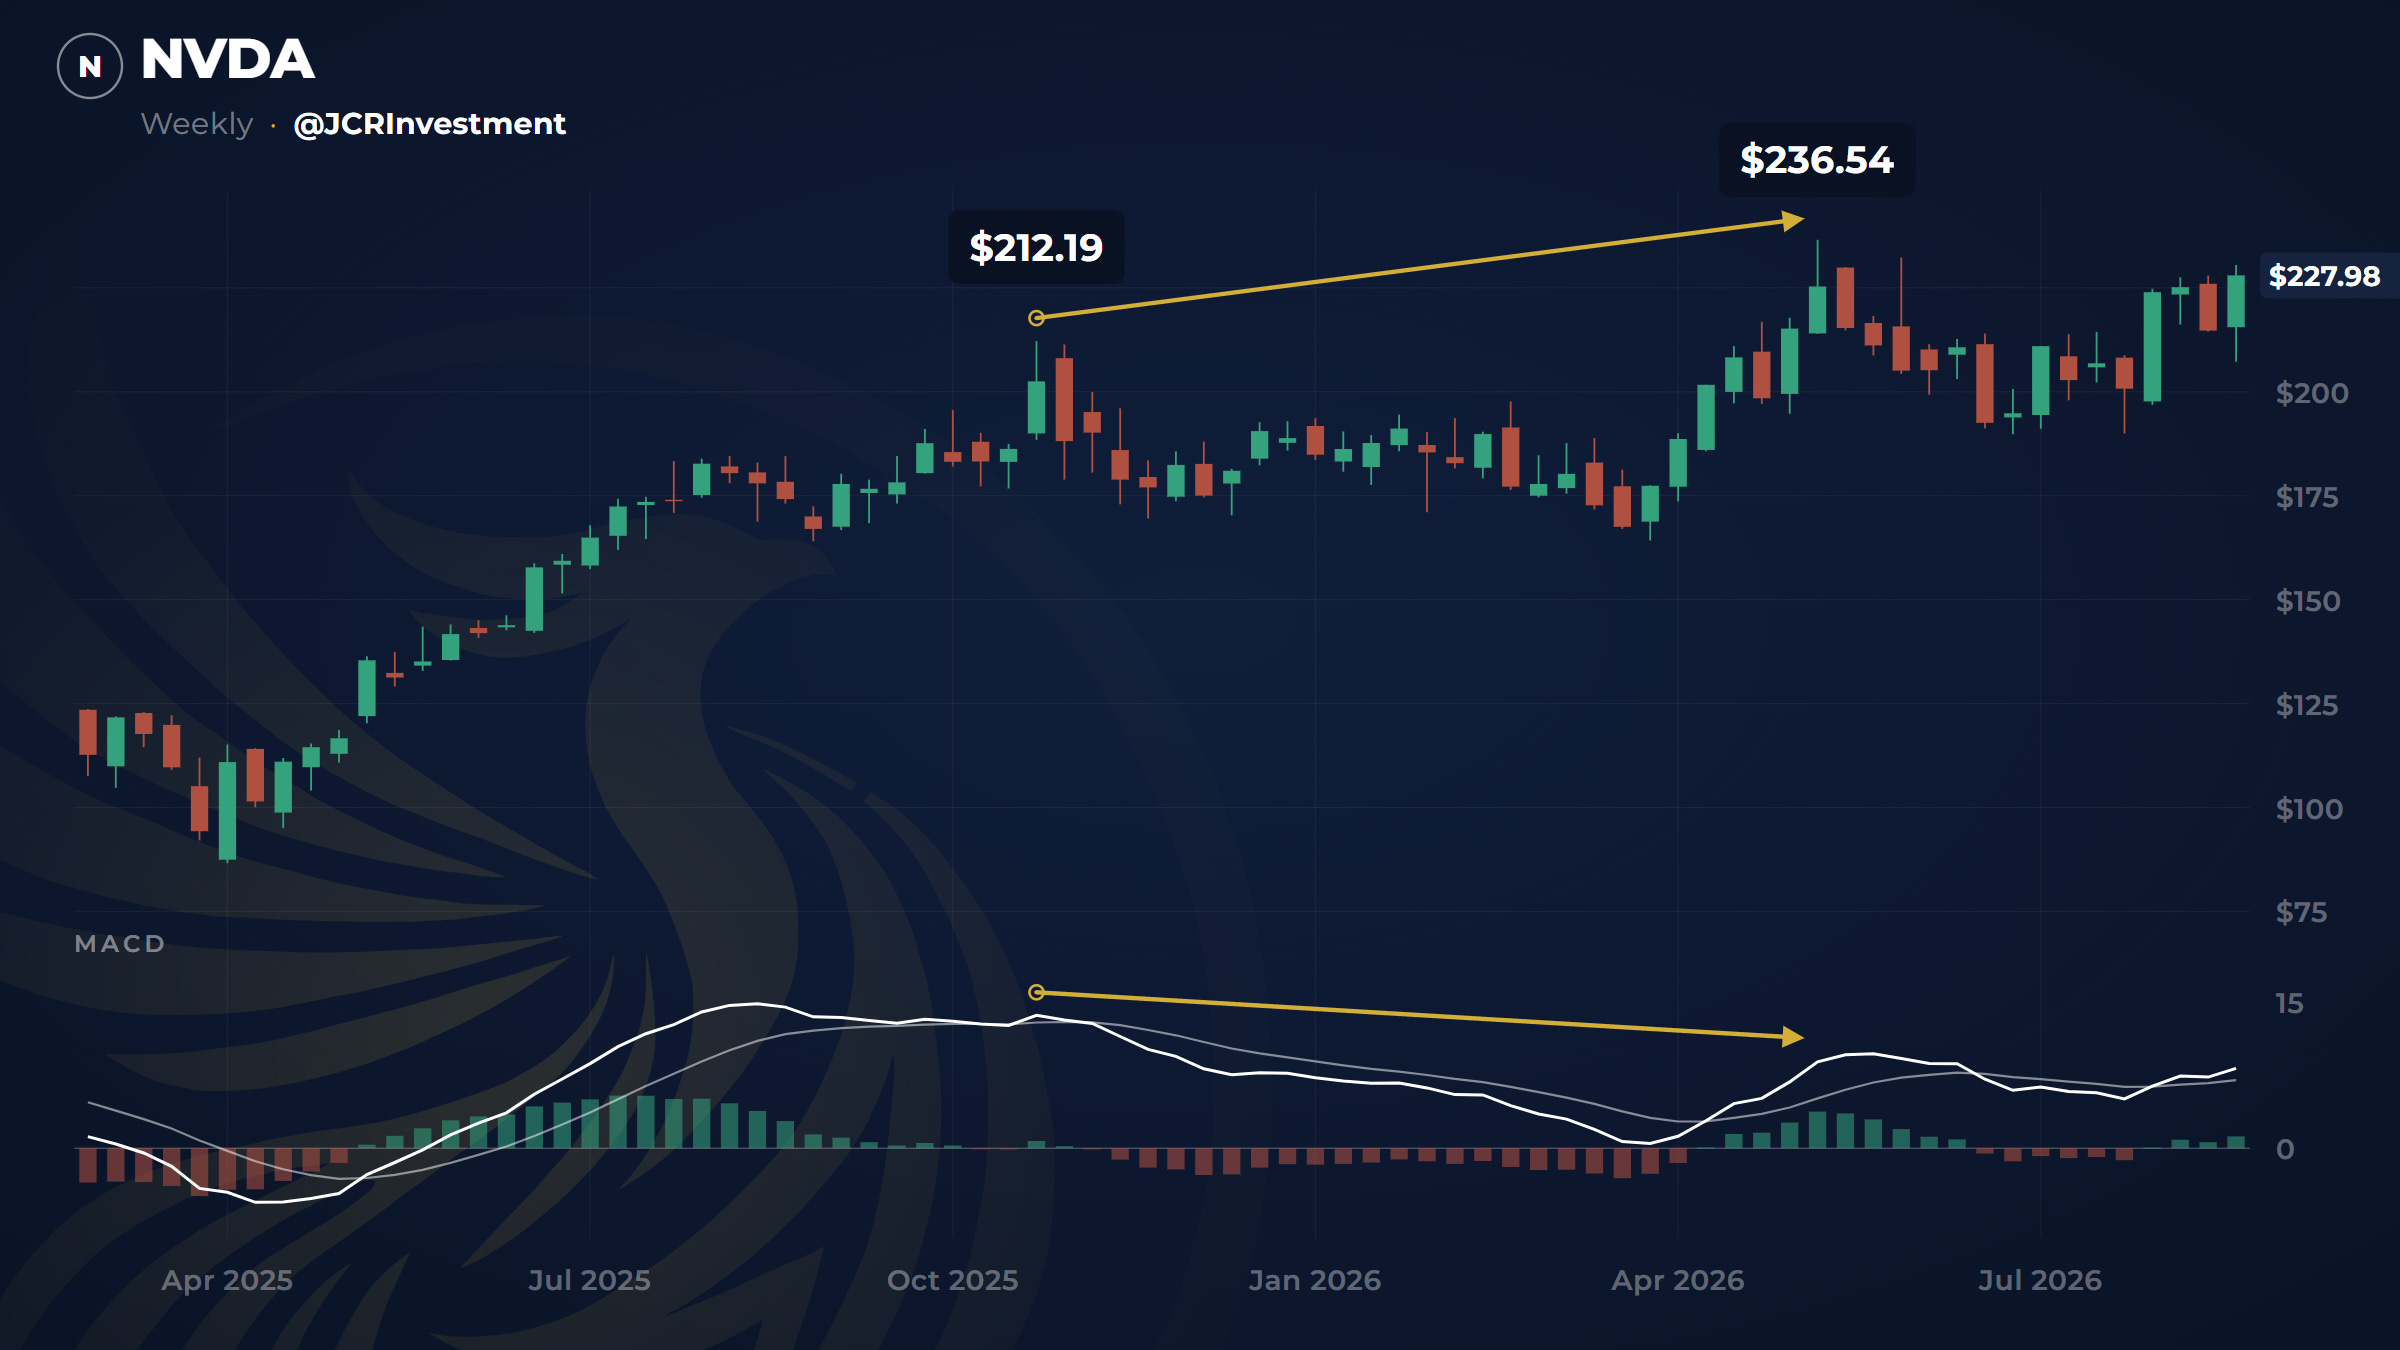
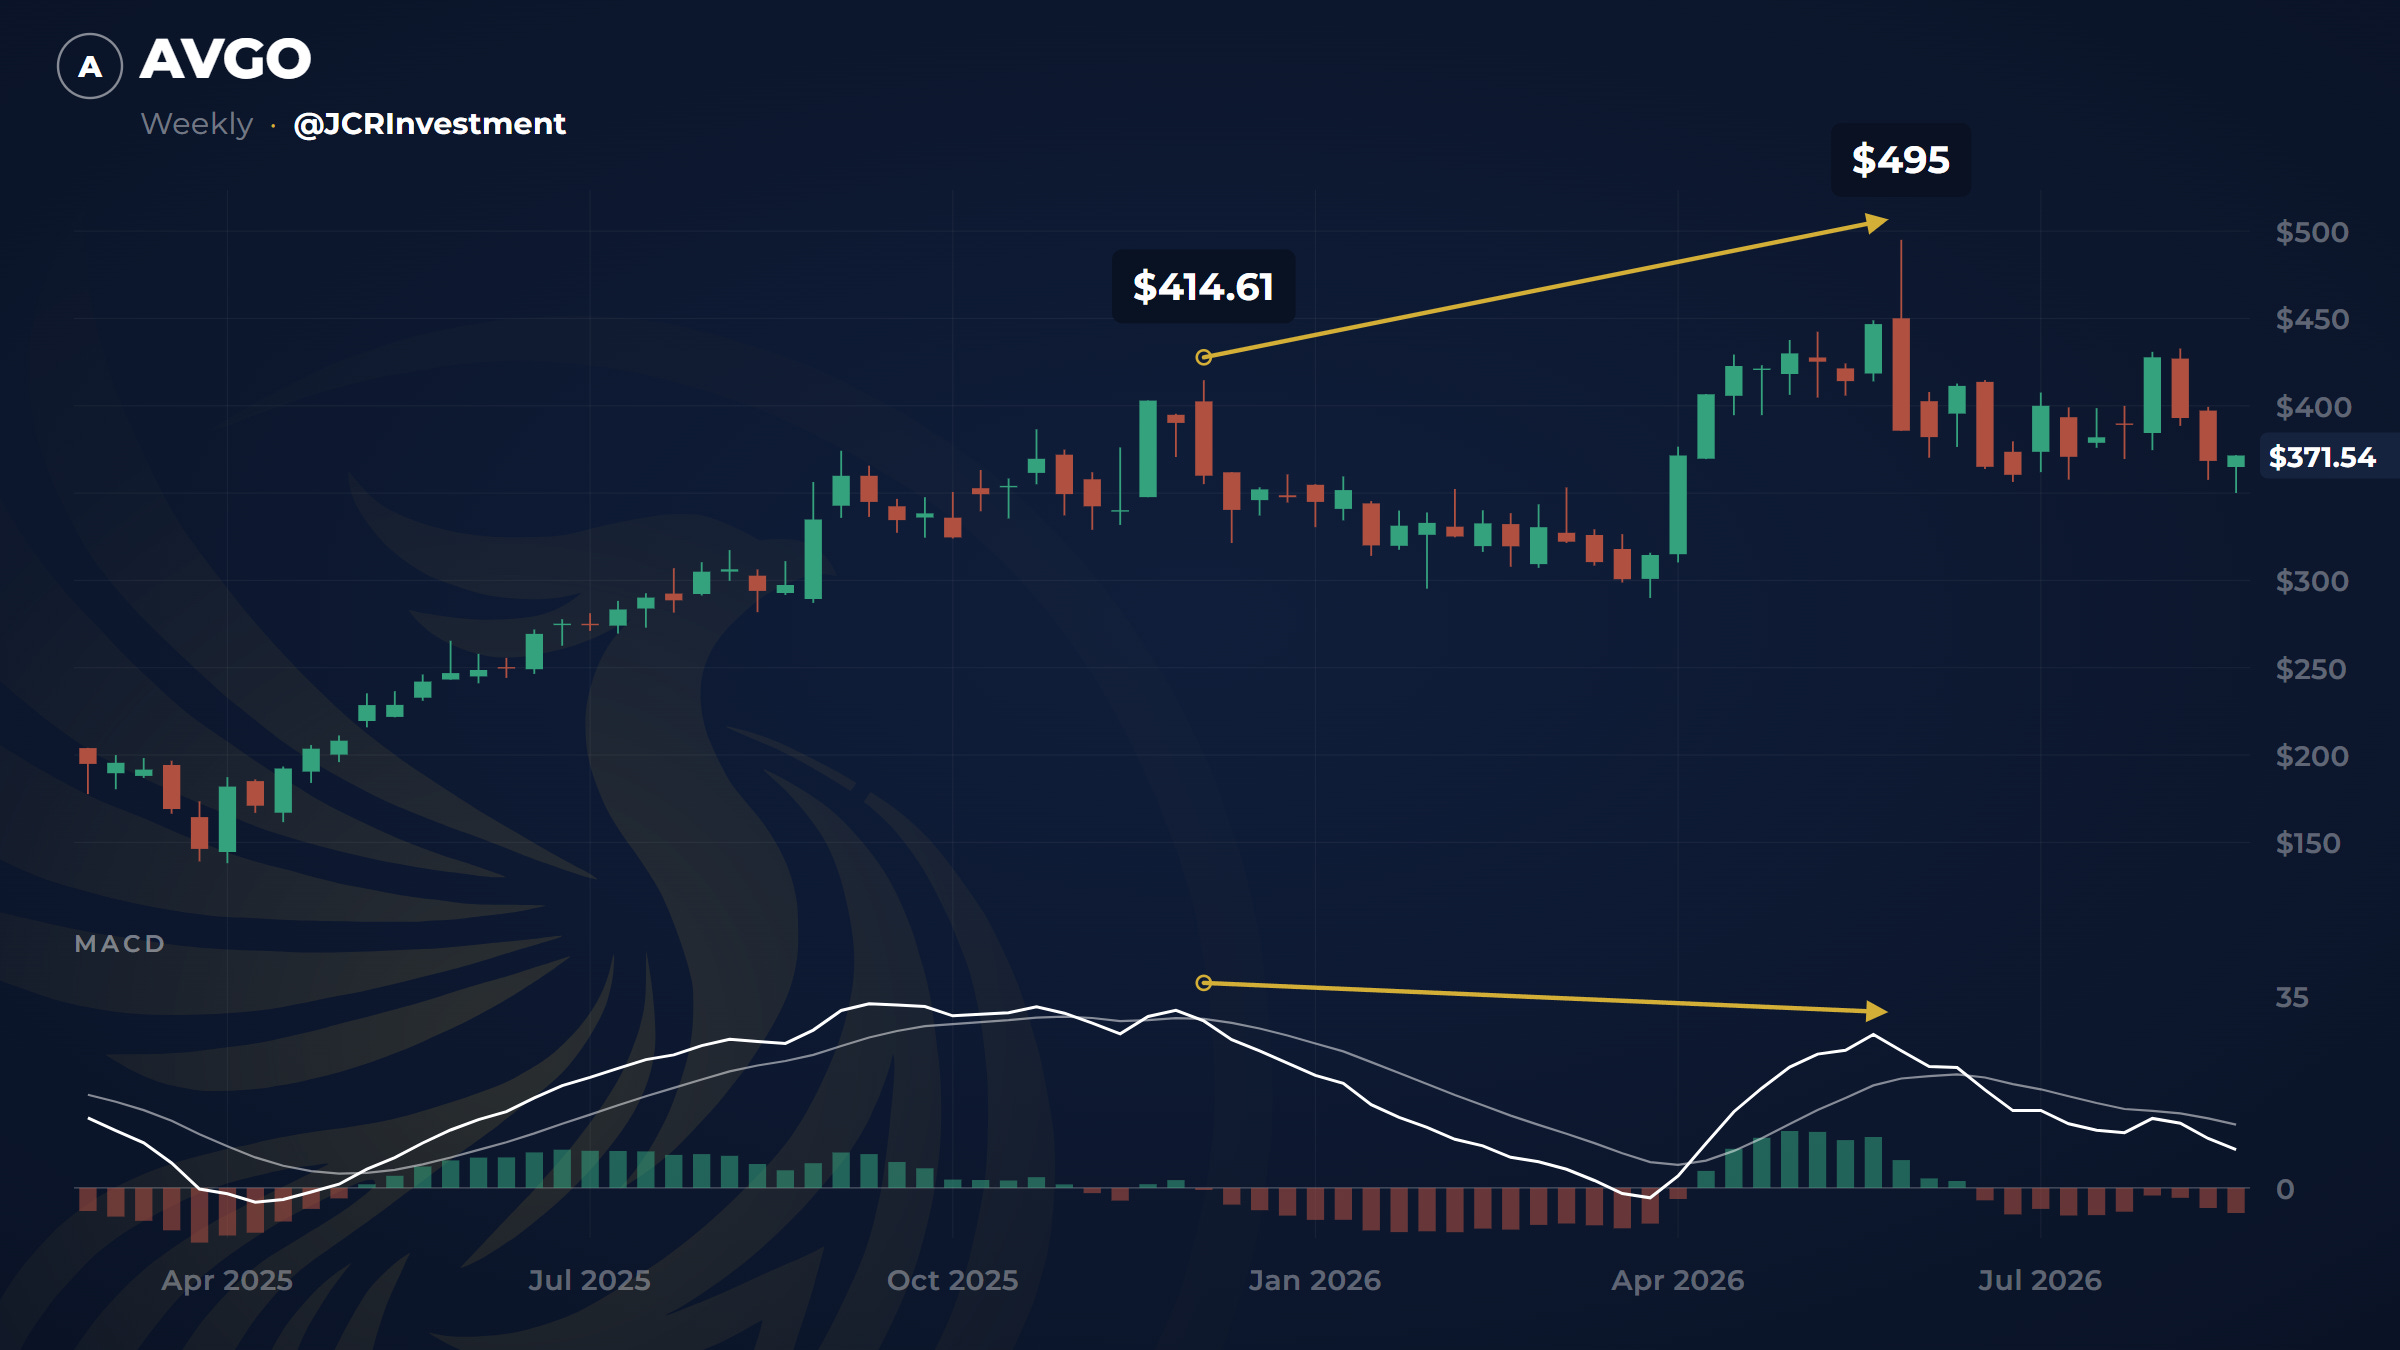
Notice a detail that is no coincidence: the tops didn’t arrive on the same day. Nvidia topped on 11 May, Alphabet on the 18th, Broadcom on 1 June.
It wasn’t a one-session scare. It was a sequence that started on the inside, in the individual stocks, and worked its way out towards the indices, week by week. That is exactly how the big rotations begin.
And who else is seeing this?
Big money. And this is where it stops being my opinion and becomes a fact anyone can check. Every week, the United States regulator publishes who is positioned in the futures market and on which side. And what it says right now is one of the most striking things I’ve seen in years.
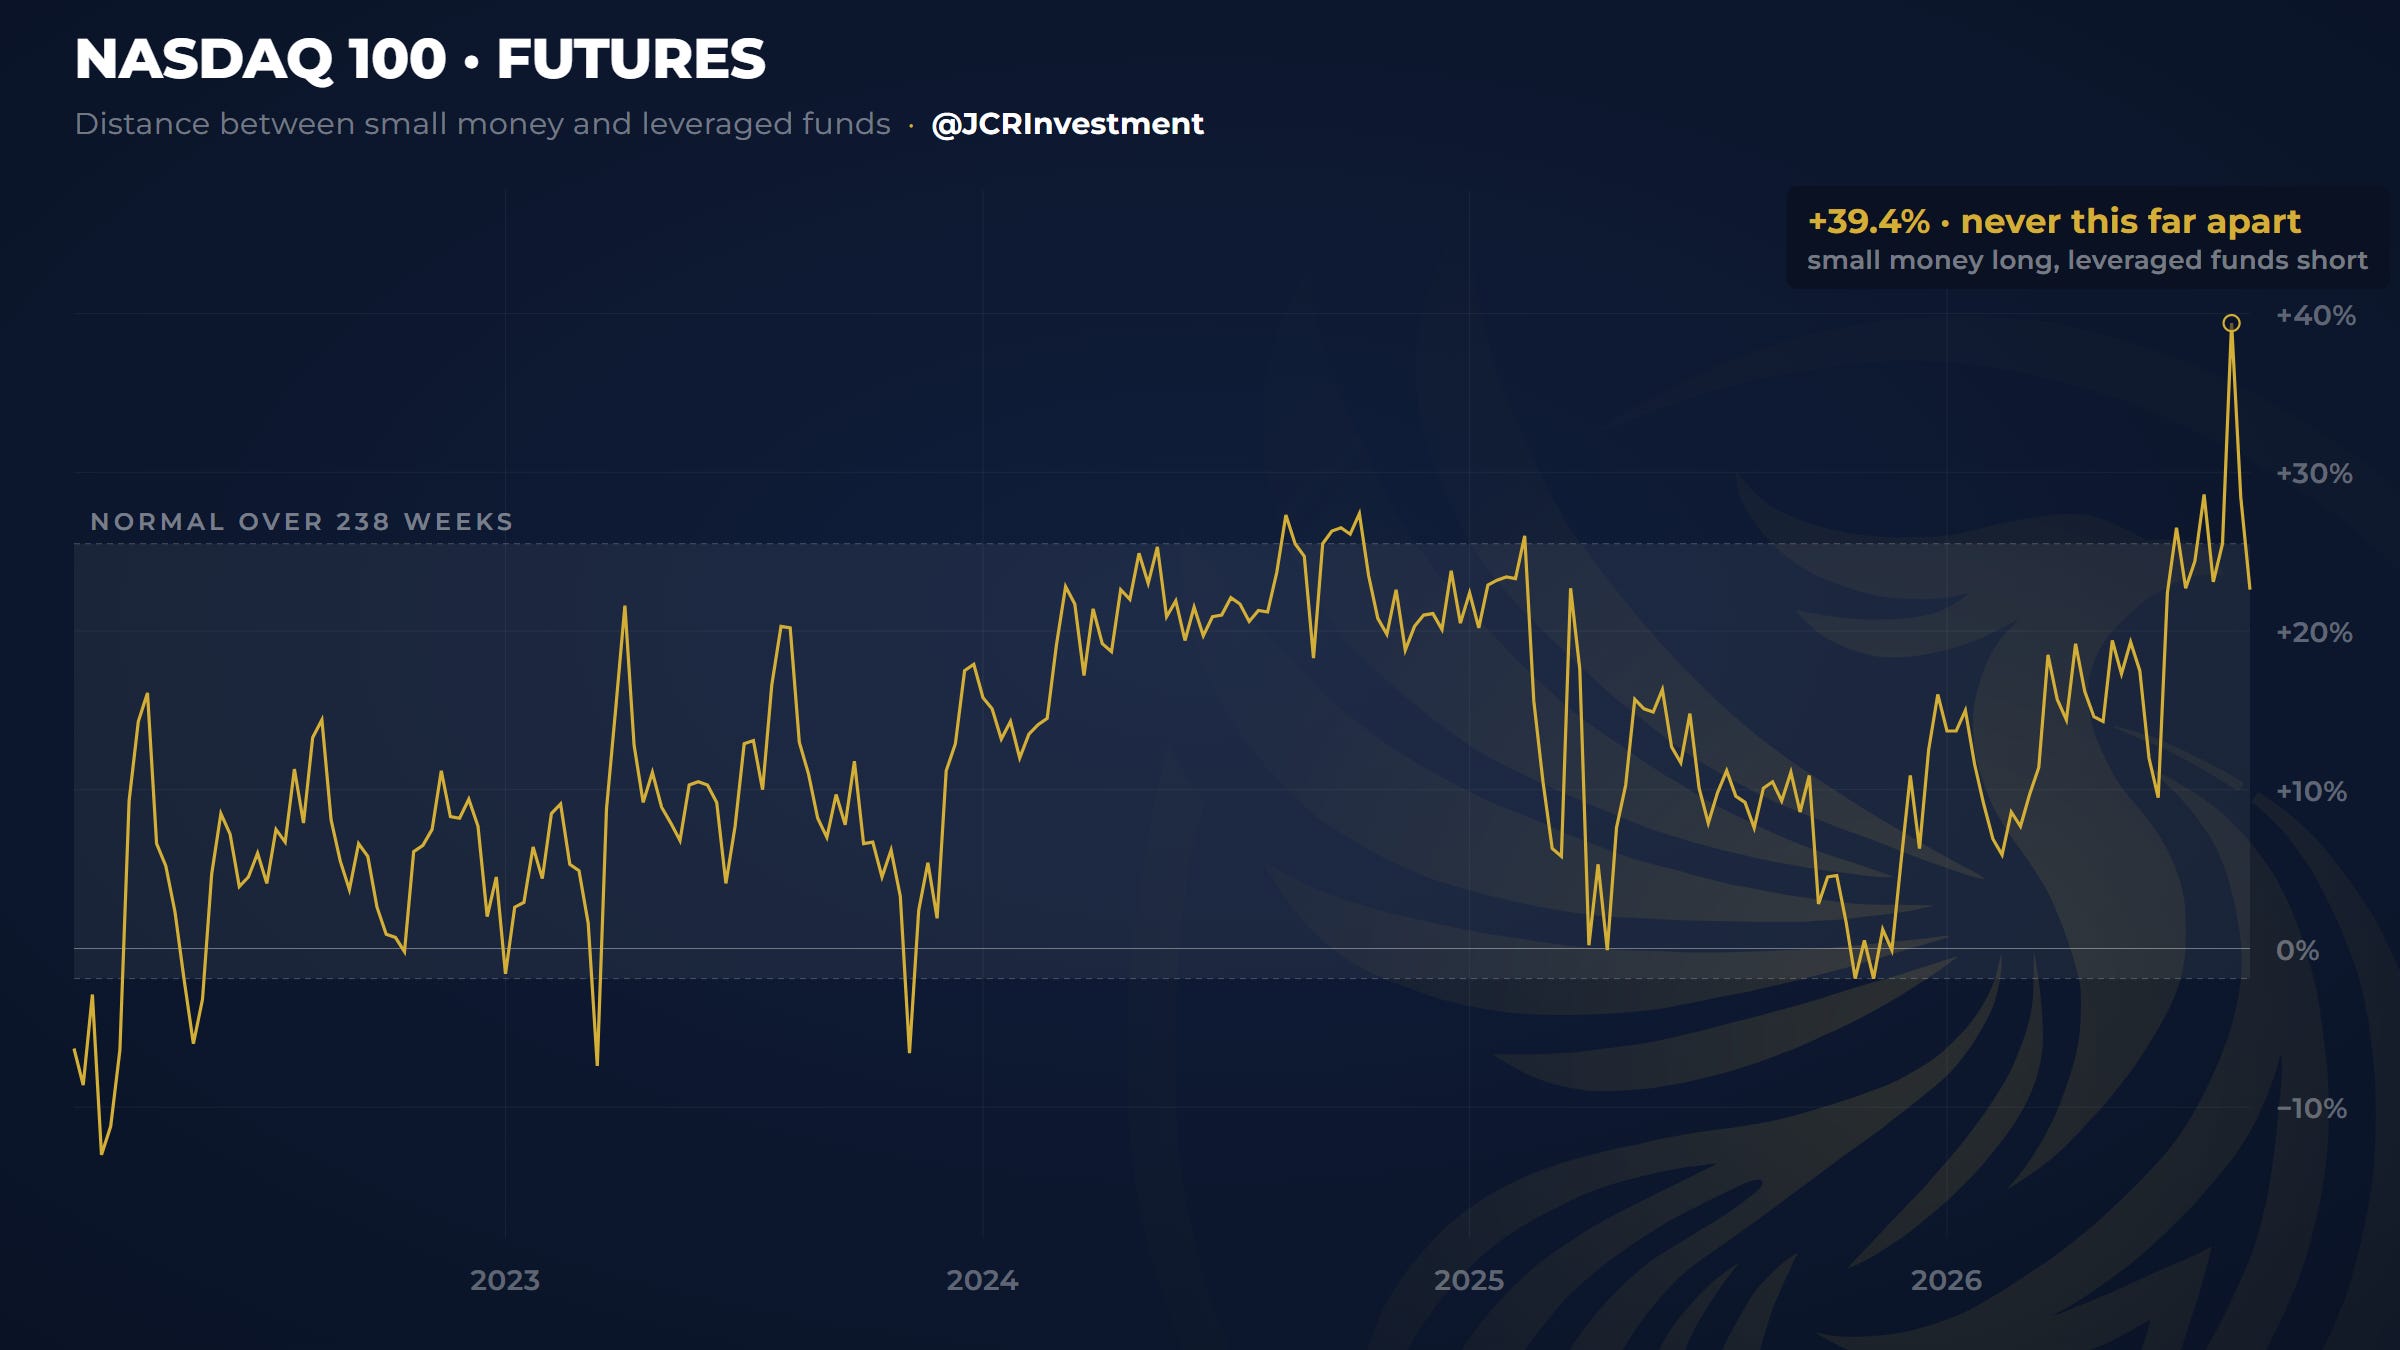
The big funds are loaded with downside positions while ordinary people buy hand over fist. The distance between the two has never been this wide in four and a half years.
That has an ugly name: distribution. Those in the know passing the paper to those who arrive late.
An important piece of honesty: a good part of that selling by the big players is hedging, not bearish bets. Many funds are long stocks and sell the index to protect themselves.
Even so, an extreme is an extreme, and the distance from the small investor is real.
And why September-December specifically?
The rest of the assets are already lining up for a tense scenario around those dates, in the classic chain: the dollar rises, bond yields rise, and that puts pressure on equities and on the most speculative corners.
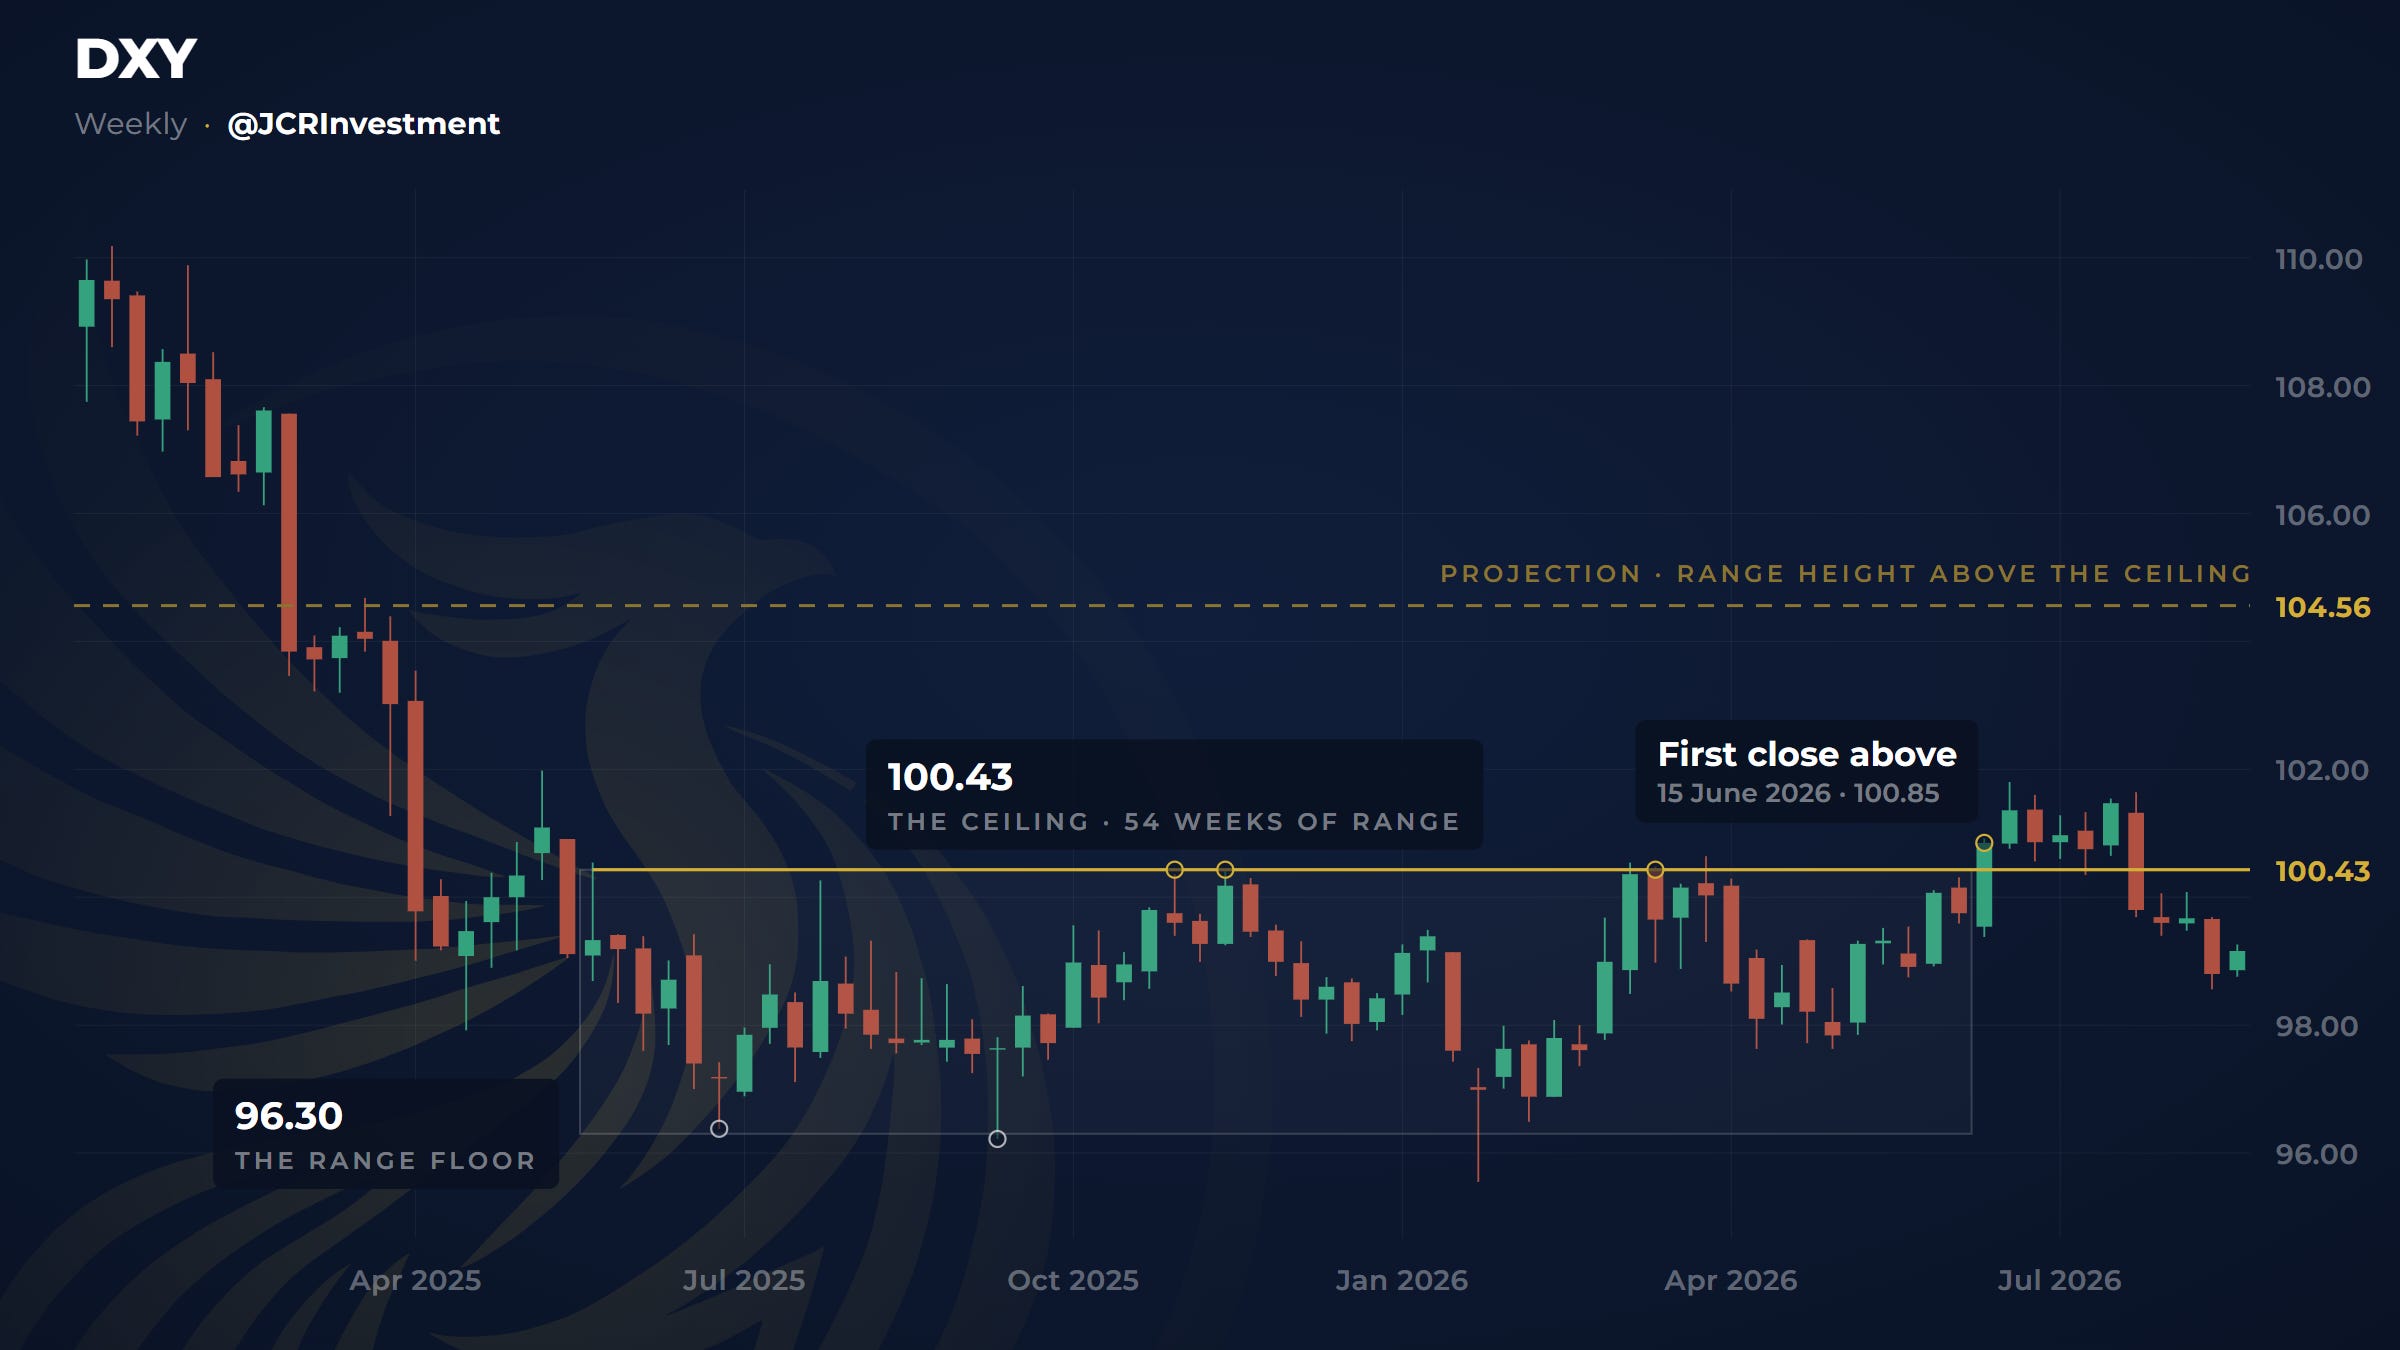
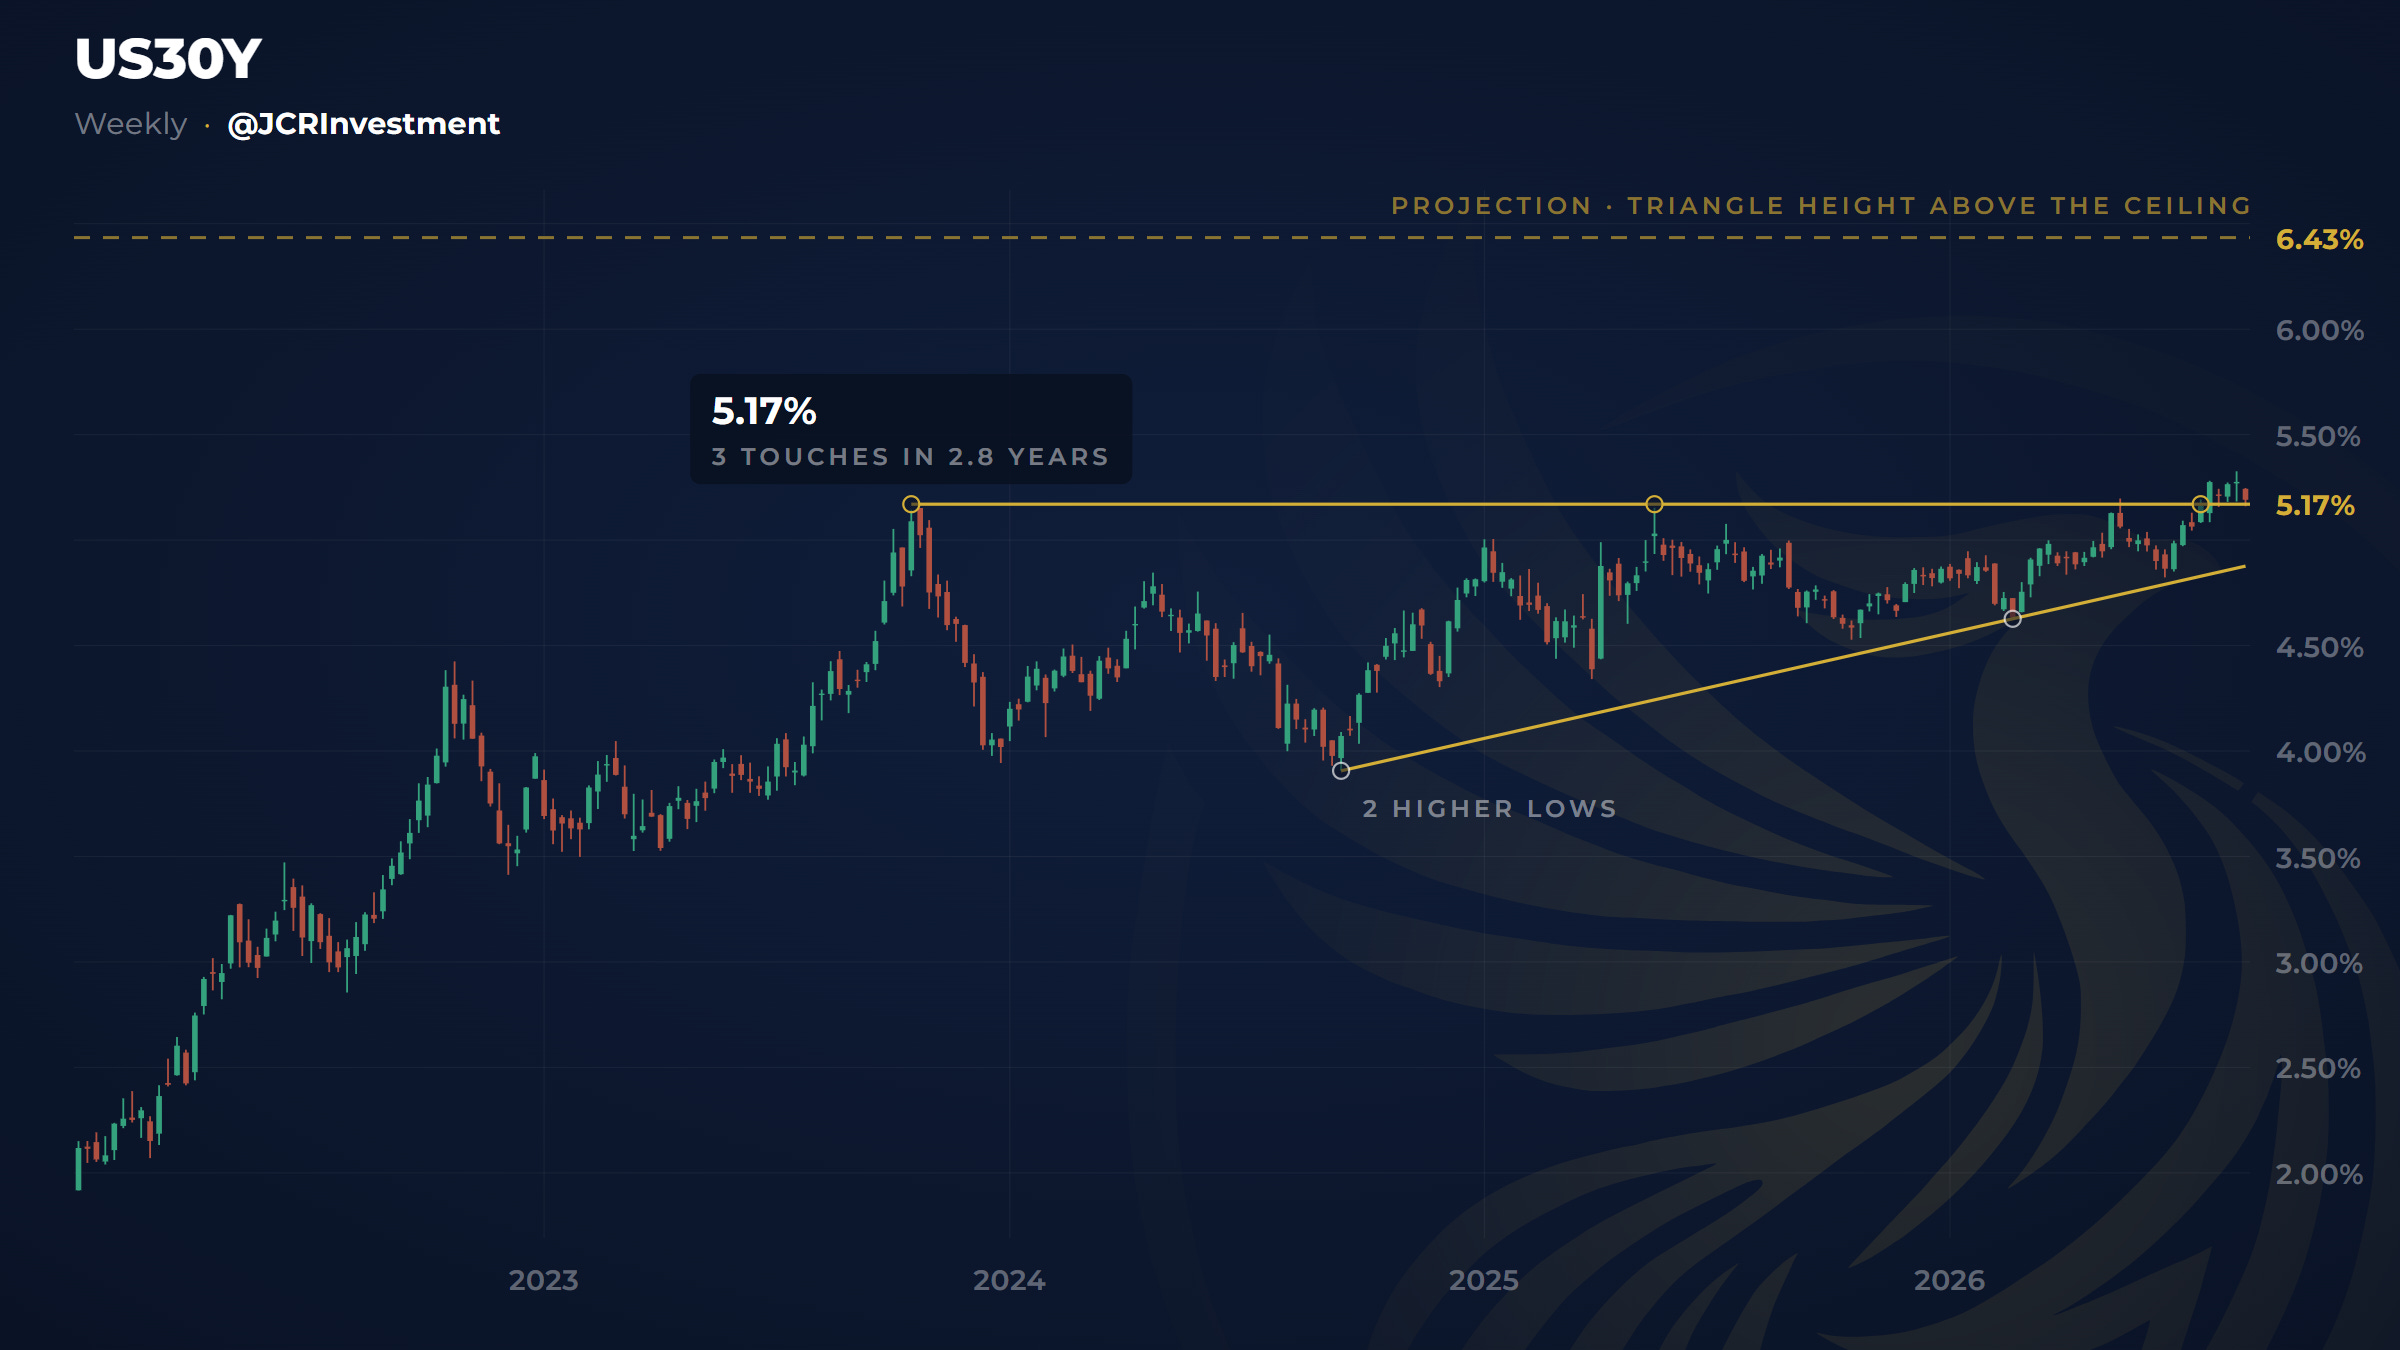
The bond matters more than it seems, and here is the mechanism: when what the bond pays rises and what companies pay doesn’t, the reward for taking equity risk shrinks. And right now that reward is at lows.
And the most nervous of the lot, as always, is bitcoin: the asset that rises most when there is too much money in the world and falls most when it starts running short. It has already lost an important support.
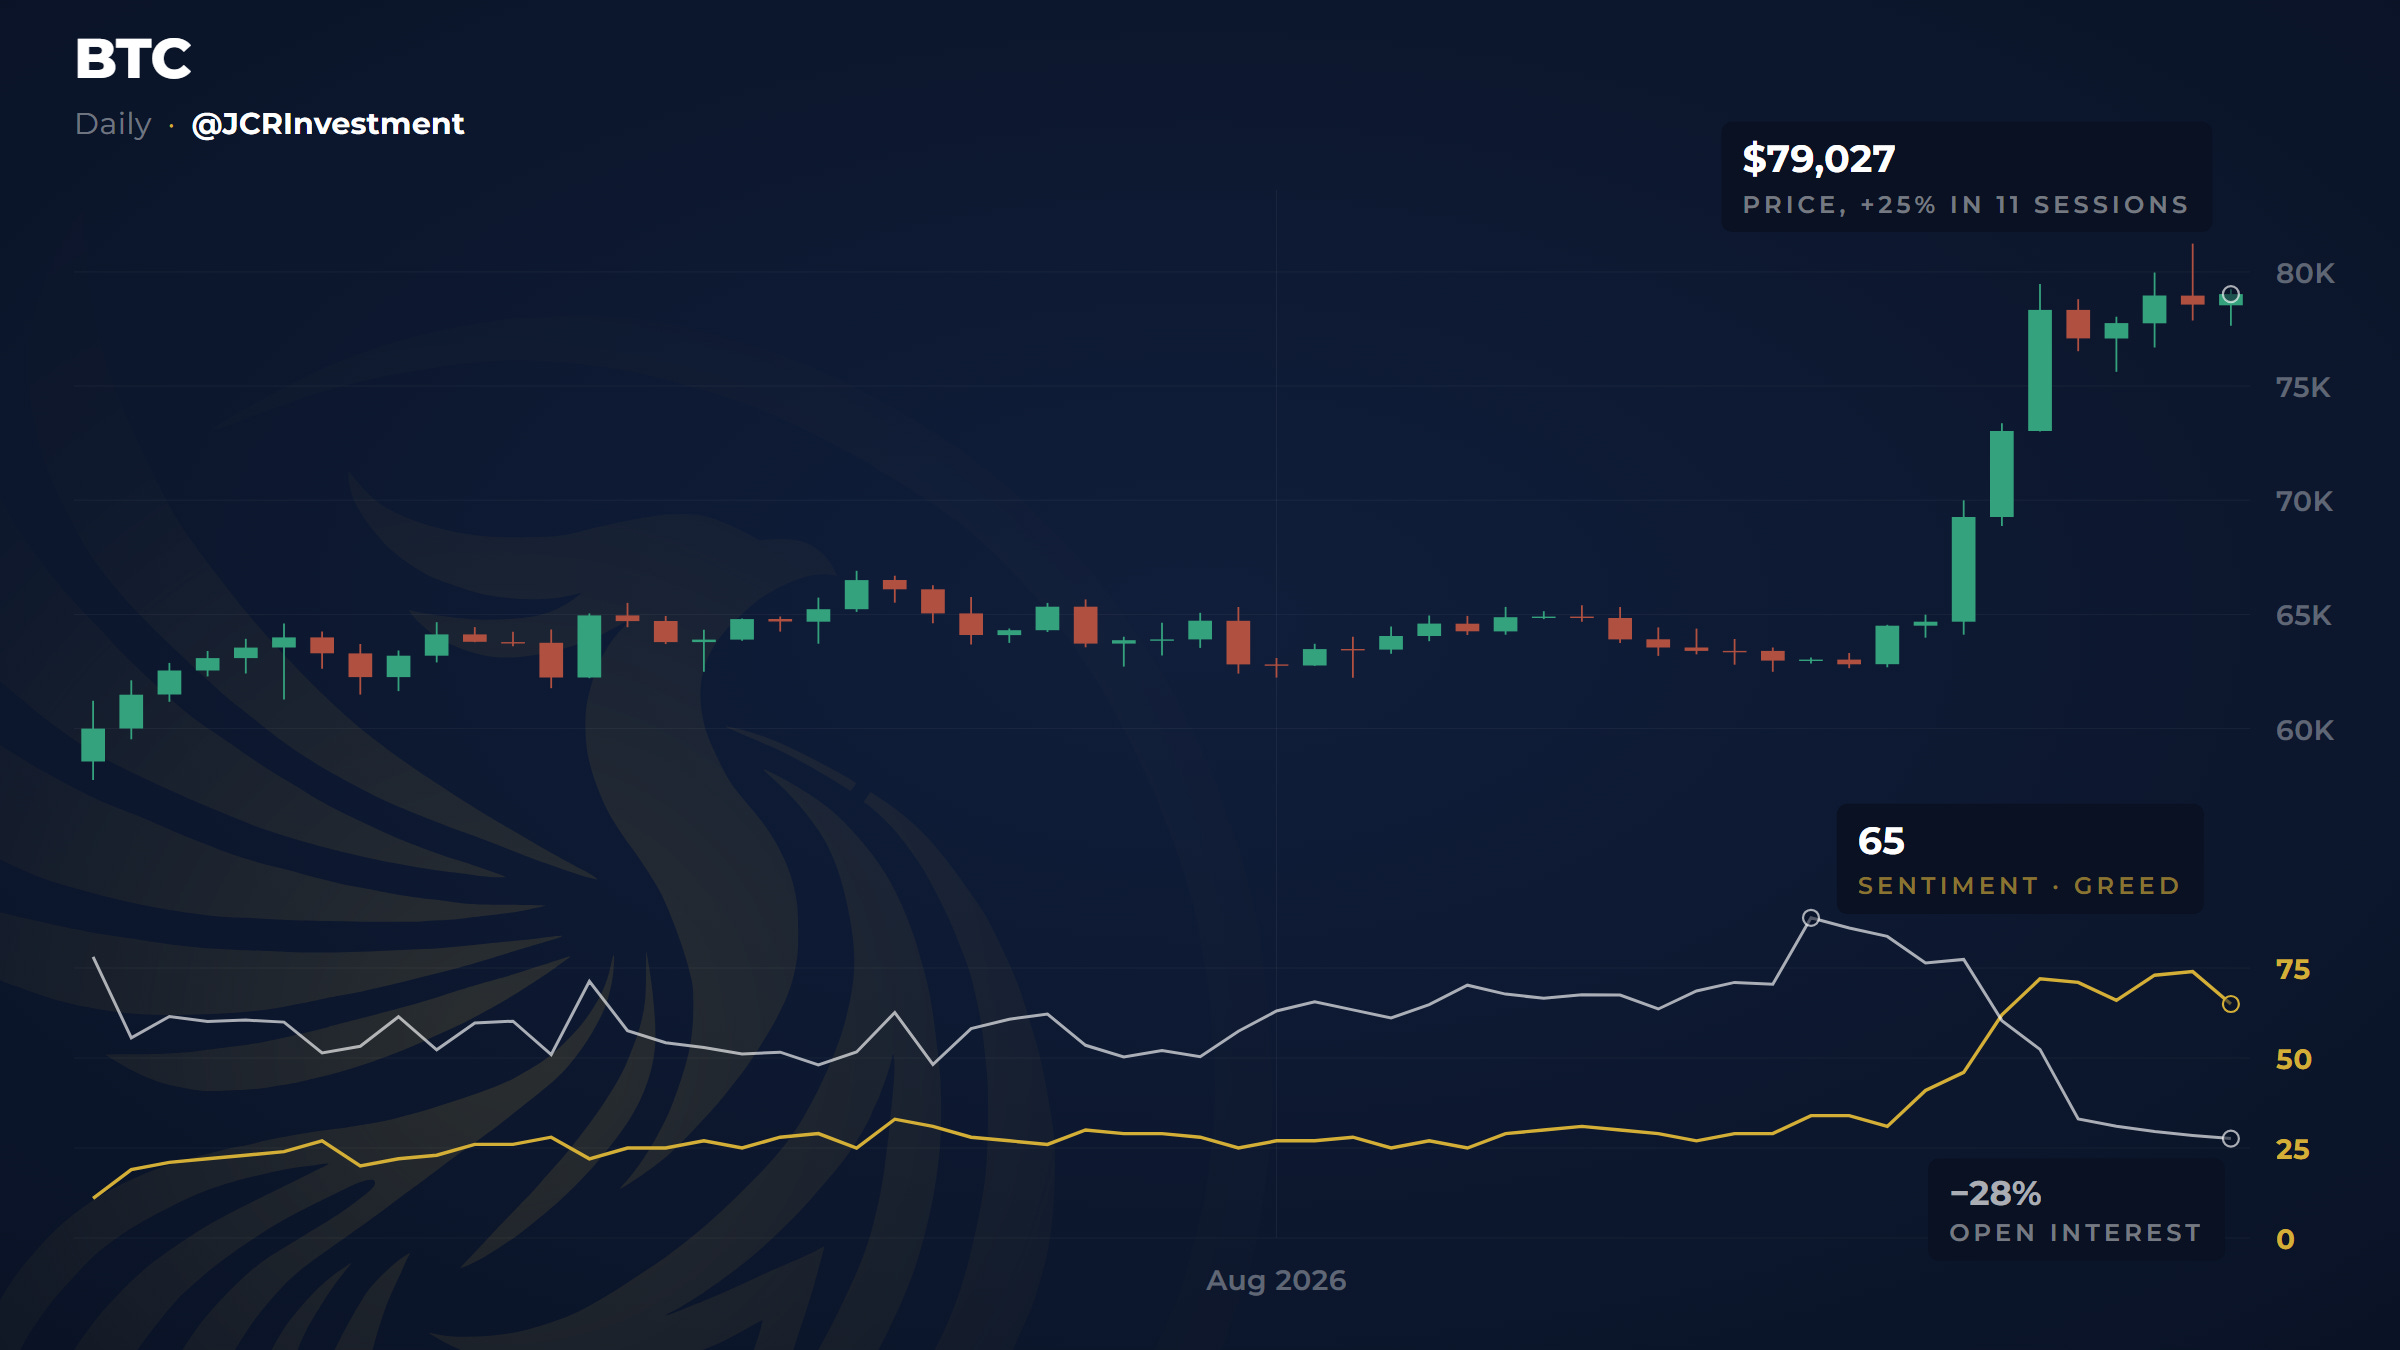
The two lines at the bottom are the whole story. The golden one is people’s mood, which has gone from fear to greed in a fortnight. The white one is the money: every bet currently live in bitcoin futures, counted in bitcoin and not in dollars, which is the only way that number doesn’t lie to you.
When the price rises and the live bets fall, buyers are not arriving: sellers are leaving. That is short covering, not money coming in.
A rally paid for by closing shorts ends the day the shorts run out.
It isn’t telling me a date. It is telling me that the most speculative corner of the market is running on mood instead of money, and that is exactly the state in which things break.
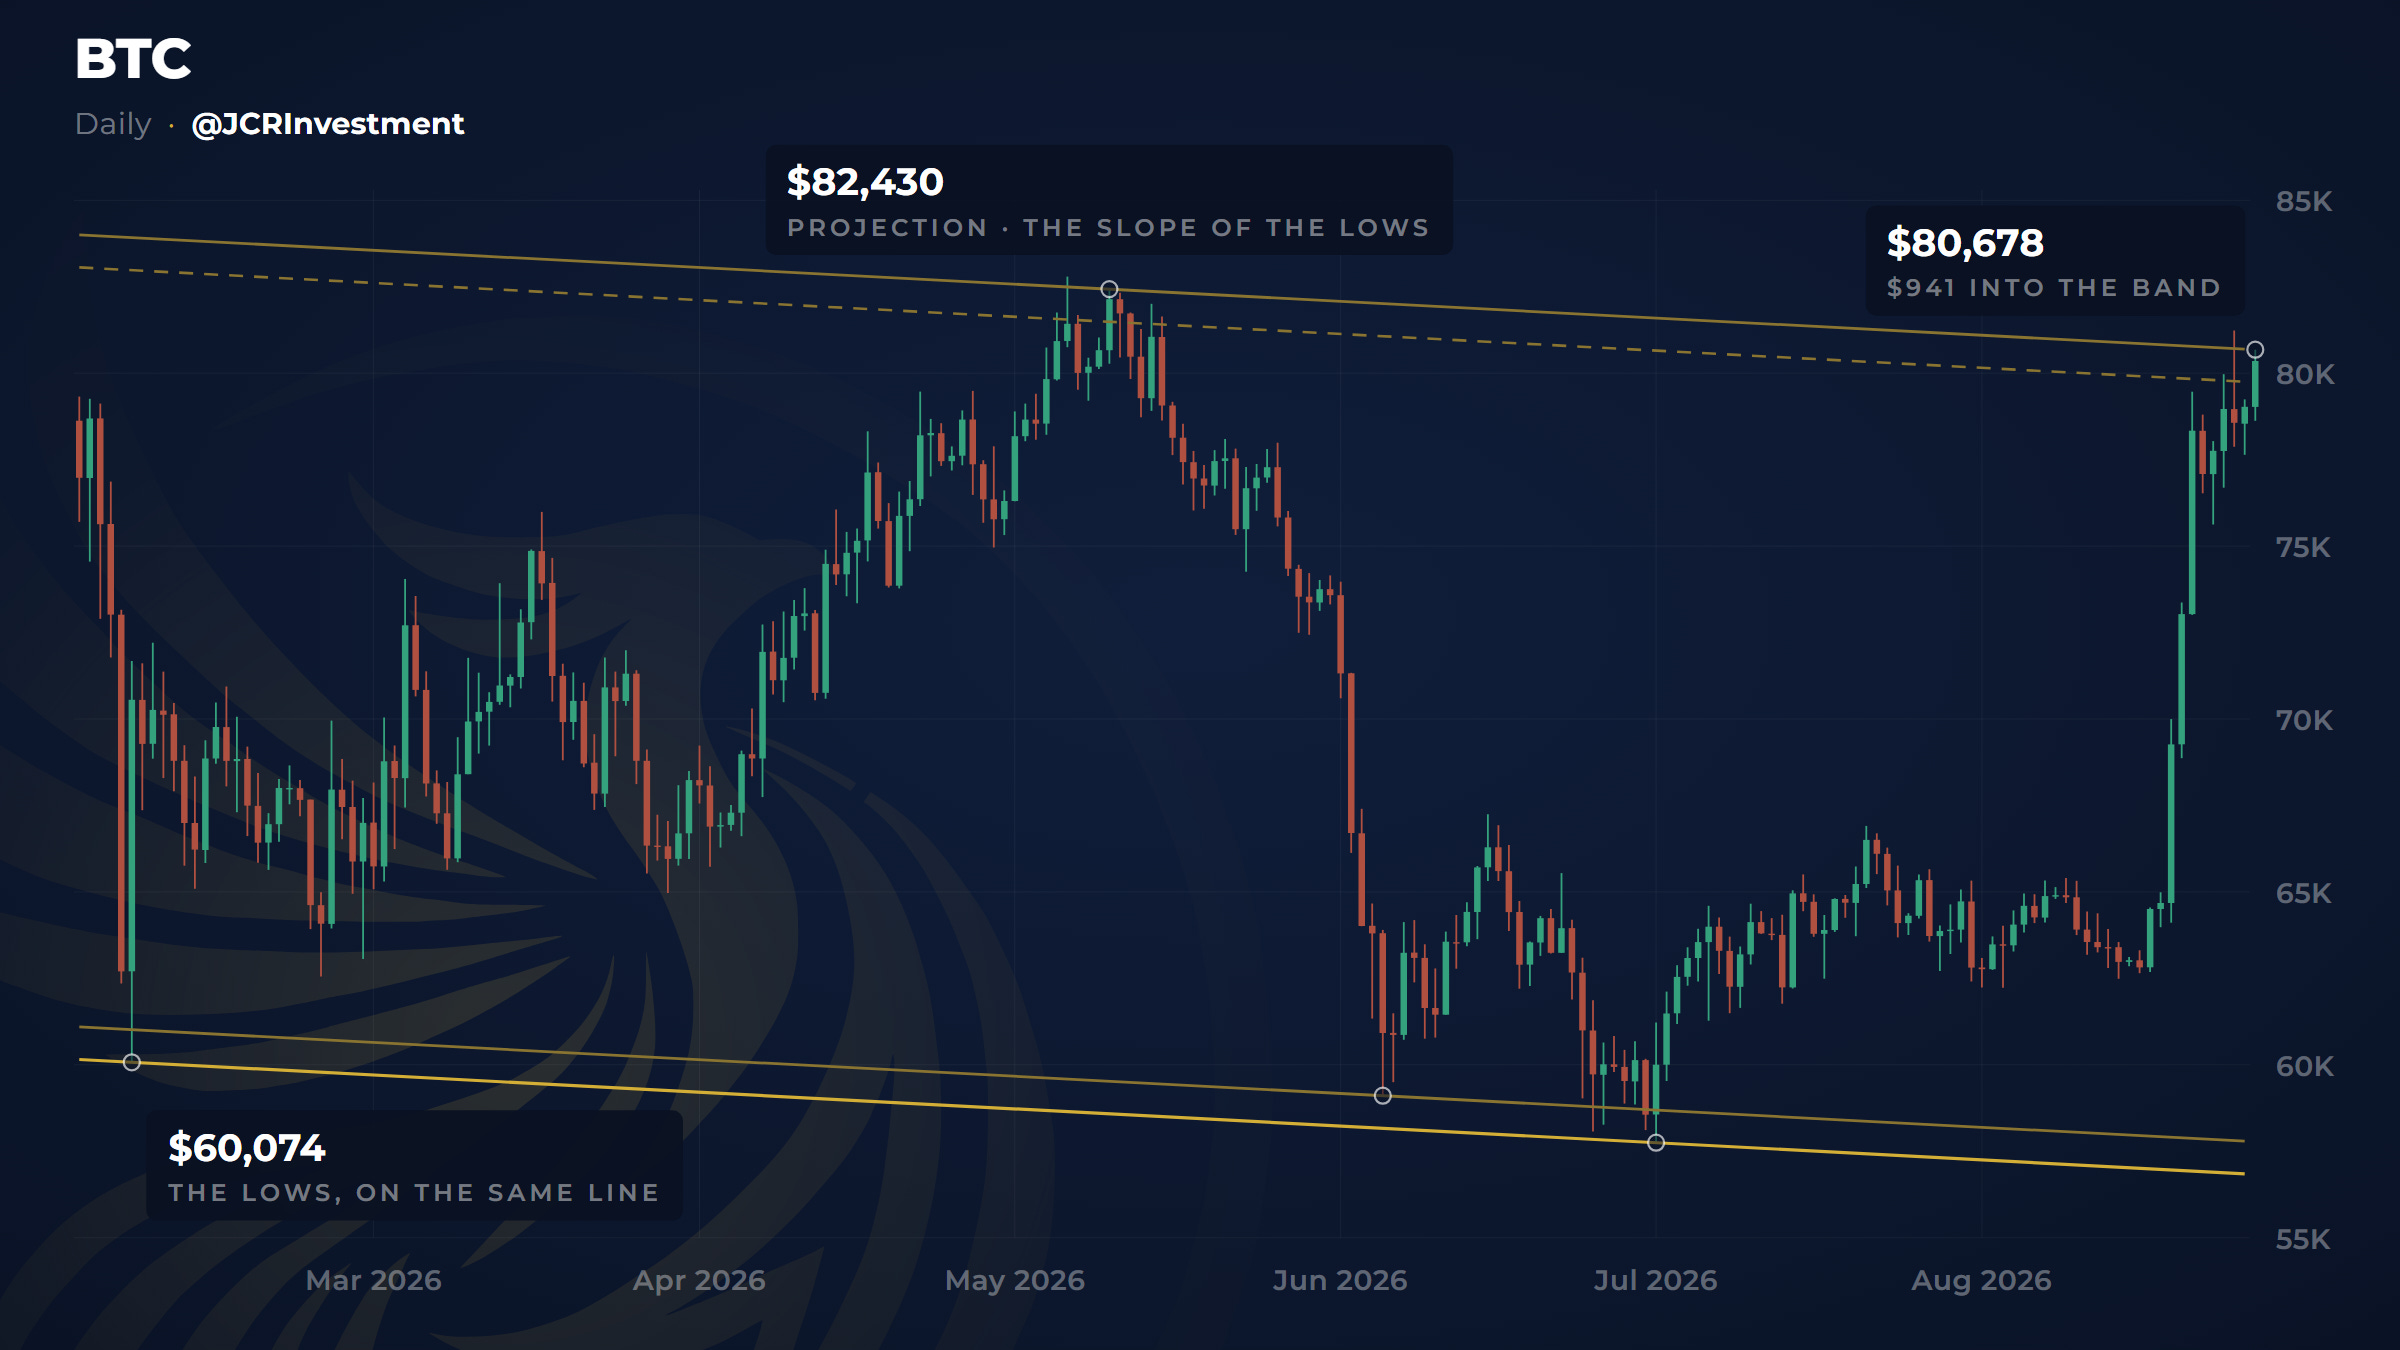
While everyone says BTC is heading back to all-time highs, and everyone is euphoric because it’s up 40% in a week, I’m still worried.
Worried because I know these moves firsthand. Worried because they don’t end well. These moves are designed to trap people in long positions, thinking it’s already going back to highs.
Once they have everyone in, they deliver one last, very violent move that makes everyone capitulate.
That’s when the strong hands start accumulating, while everyone else says BTC is finished, and that’s when it actually puts in a real bottom.
For all of the above, I believe this move in BTC is part of everything that’s being set up, and that’s why I’m asking you to be careful with this kind of move.
The worst for BTC may still be ahead.
So what’s actually happening in the world right now?
Throughout this article we have looked at different assets. All of them are pointing to exactly the same thing: they are lining up at the same time for a correction.
When everything is telling you the same story, at the same time and in the same window, the sensible thing is to listen, not to follow the crowd.
Now add the macro backdrop we are living through. An unresolved conflict with Iran that could send oil much higher and force the Fed’s hand to hike rates.
A yen carry trade that the Bank of Japan has decided to start unwinding, raising rates to defend its currency.
And a midterm calendar where, statistically, September and October are the worst months for equities, with October often being the month when the market puts in its bottom.
And how will I know if it’s a correction or something worse?
That’s the million-dollar question, and the honest answer is: it will depend on how complicated things get along the way.
A correction is a healthy fall that clears excesses within a trend that is still alive. A bear market is a deeper wound.
The difference between the two isn’t decided by a chart: it’s decided by the data from the real economy.
It turns into something worse if…
Credit starts tightening all at once.
Oil stays above $100.
The dollar and rates keep rising unchecked.
One of the system’s pipes breaks, like the yen carry trade.
It stays a correction if…
Credit stays calm, with no tension between banks.
Unemployment stays low and people keep their jobs.
Company earnings are not revised downwards.
Oil and the tension with Iran calm down.
The more oil, the dollar and rates rise, the more dangerous a bear market becomes and the less likely a clean correction. Today, as I write this, the balance tilts towards a correction: the economy is holding. But there’s one question I keep turning over and don’t want to hide from you, because it’s the key to everything.
So, is this 2000 all over again?
No. And this is the part I most want you to take away, because it’s the hope inside all this caution. Even though everybody tells you this is just like the dotcom bubble, it looks far more like 1998: a market at demanding prices, yes, but without the unleashed euphoria or the widespread madness of 2000.
It’s expensive, it’s not euphoric. And many of the companies leading today genuinely make money, which wasn’t the case in 2000.
And here is the chart that, for me, changes everything. Not only for what it shows, but for what it implies underneath.
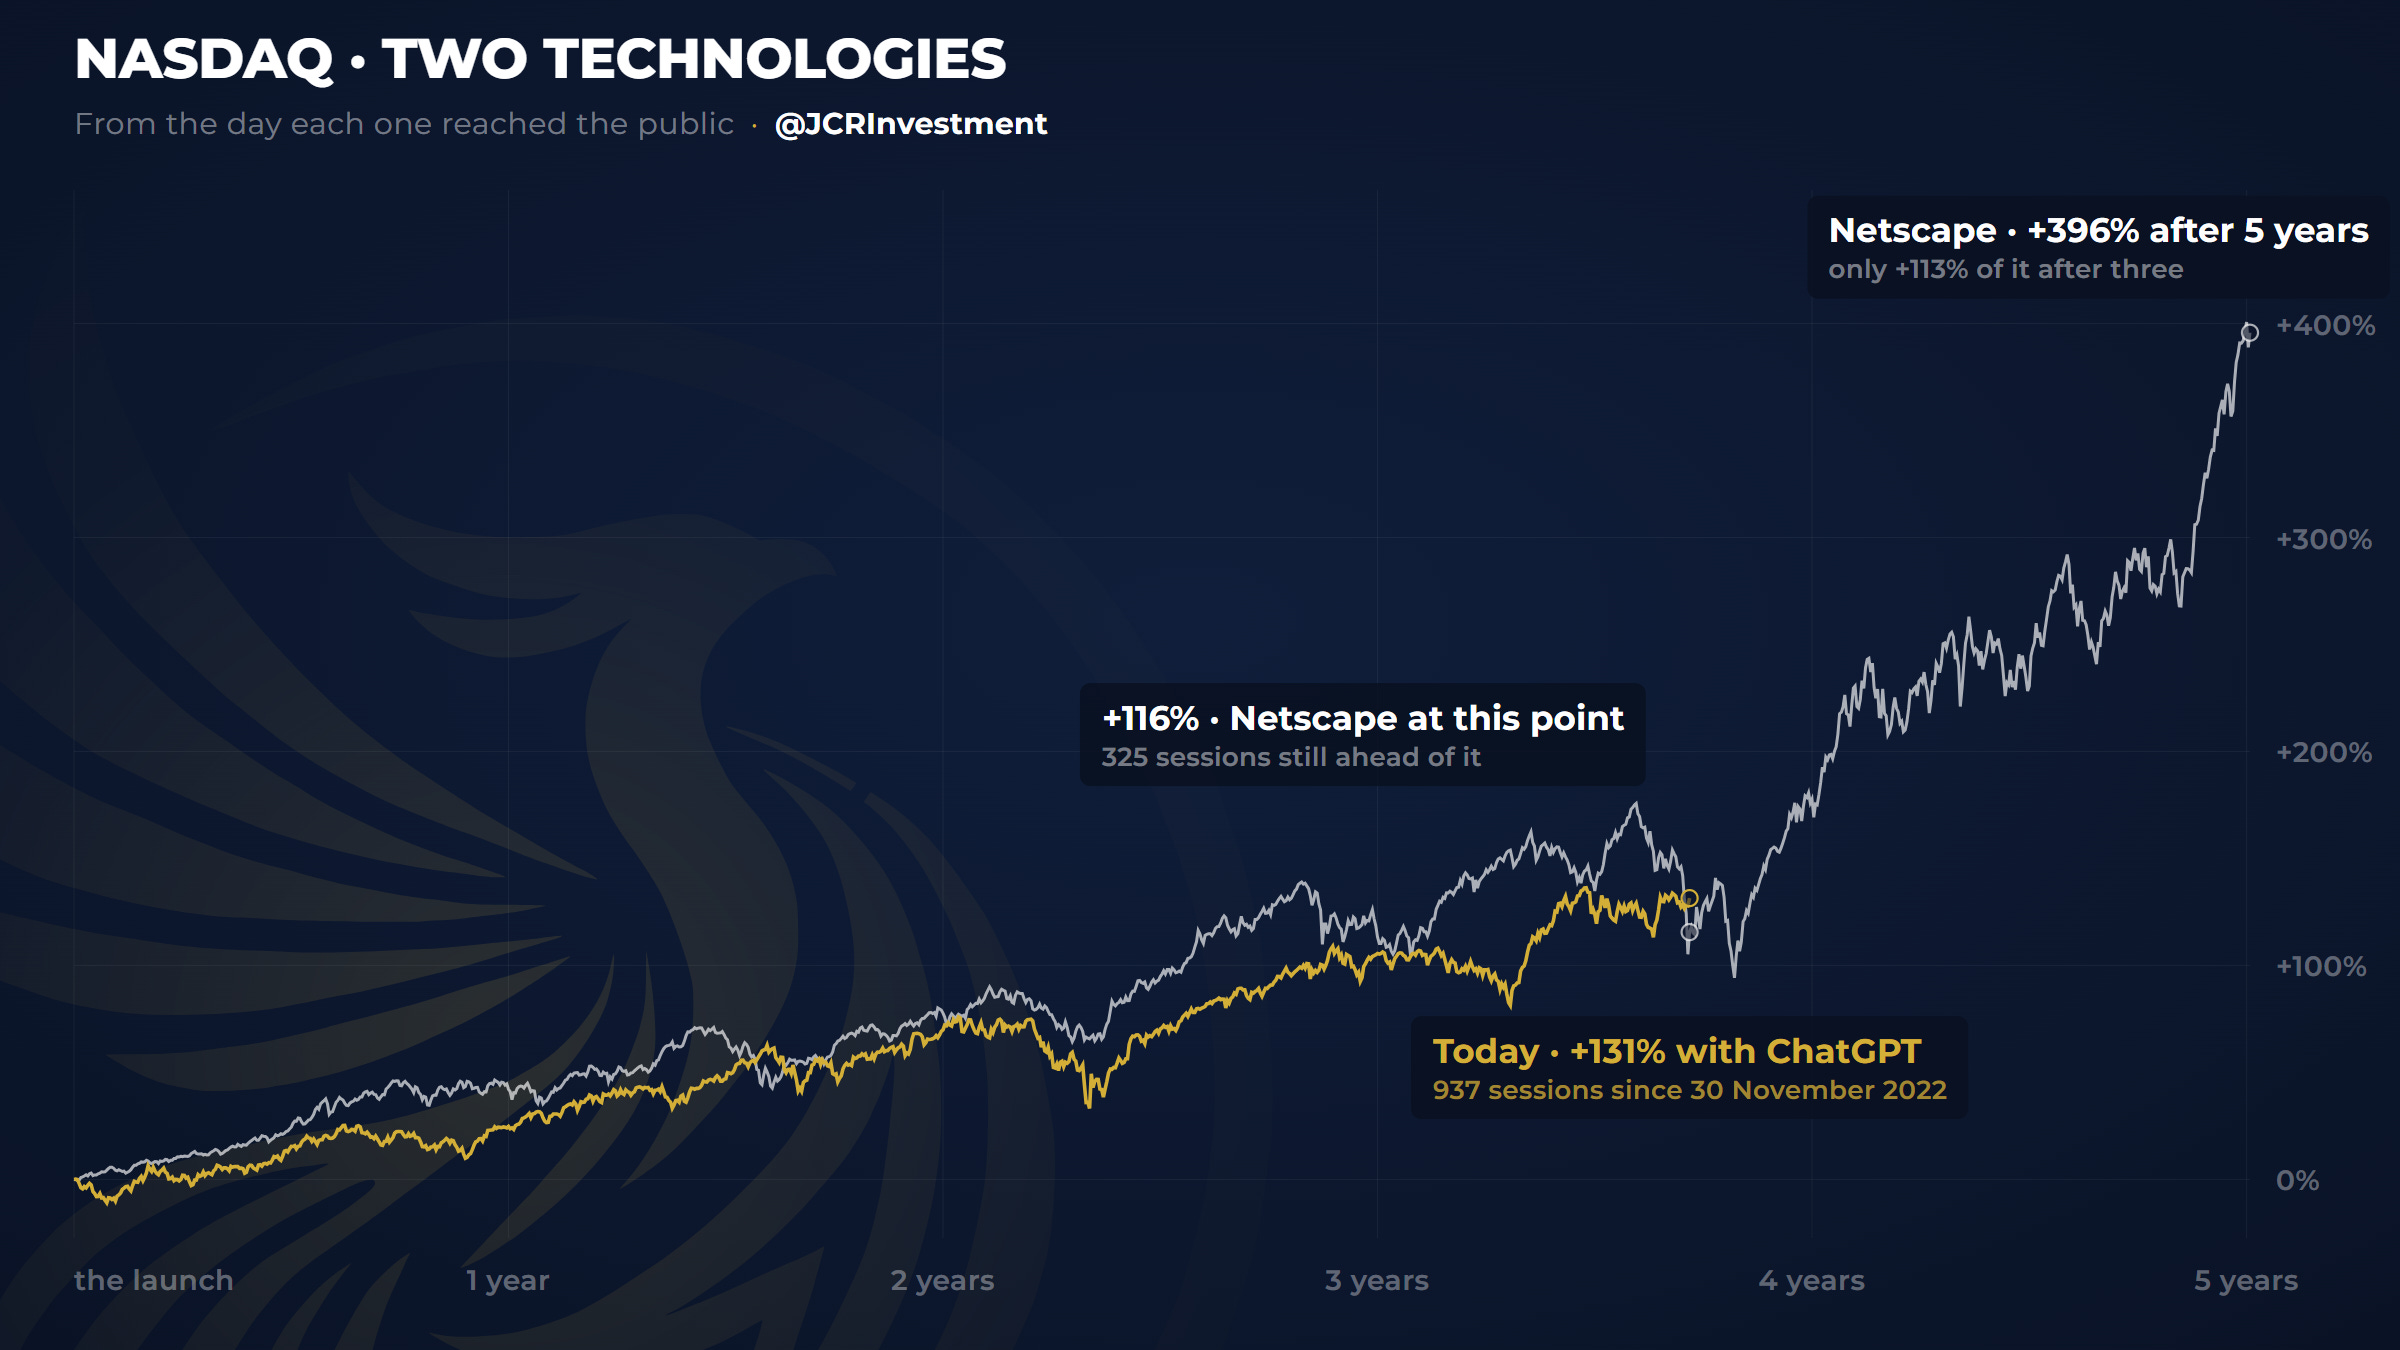
Every big bubble is born of the same thing: people believing a change is going to happen overnight.
In 2000, they thought the internet would roll out in three years. It took fifteen. Today people say AI is going to change the world, and they’re probably right, but it will take its time.
And that gap between the hope and the reality is precisely the fuel of bubbles.
Look at the golden line: at this same point of the journey, the internet still had its biggest rises ahead. The bulk came after where we are now.
That’s why a fall now, if it doesn’t end in something worse, is not the end of the party: it can be the best way into a party that still has years to run. A scare and an opportunity, not a funeral.
And what does this chart really mean?
Before answering that question, I want us to answer this one:
What does the market truly exist for?
Not for you to make money. That’s what almost everyone believes. Wrong. And what that chart implies is no small thing, so let me explain it in the simplest way I can.
The market exists to move capital that isn’t producing towards the places in the economy where it does produce.
That is its job, and its only one. Whether you win or lose along the way is a matter of complete indifference to it.
It moves exactly as it has to, in order to leave as many people as possible out of the game, as many times as possible.
The deal, when you put your money in the right place, is this: that company becomes more productive, earns more, and in exchange you get paid, in dividends or in the value of your share.
And what is the right place? The one where capital has decided to place its bet in order to turn someone into a leader.
Look at SpaceX: its accounts today don’t come close to supporting that figure, and even so it has come to market valued at two trillion dollars. Why?
Because capital has decided it should be the flagship of American space exploration for the coming years. And when that decision is taken, the price doesn’t wait for the earnings: it comes before them.
That’s why the chart above isn’t comparing two technologies for the sake of it, nor putting two indices side by side by chance.
It compares how capital moves the whole machinery to raise a technology that is going to change the world, and to rule it. Two different technologies, in different eras, following the same playbook.
The Decision
That’s why the $40,000 portfolio deliberately stands still, and not because I’m afraid.
The bubble in chips, the cracks in the big names, big money selling, and everything we have seen in this article. The whole picture tells me today is not the moment, and that waiting costs almost nothing.
And I’m not afraid of the correction. Quite the opposite. If the economy holds and this stays a scare, it will be one of the best buying opportunities in many years, for a simple reason:
AI is reshaping the world and, like every great technology, it is going to inflate enormous bubbles. So far it has only inflated one, the chips. And we’ve already seen the playbook they use.
Every week I’ll publish a new market breakdown like this one and update every move in the portfolio, mistakes included.
Good luck, investor.